VGP Red+Green for Amibroker (AFL)
abc555 over 15 years ago Amibroker (AFL)
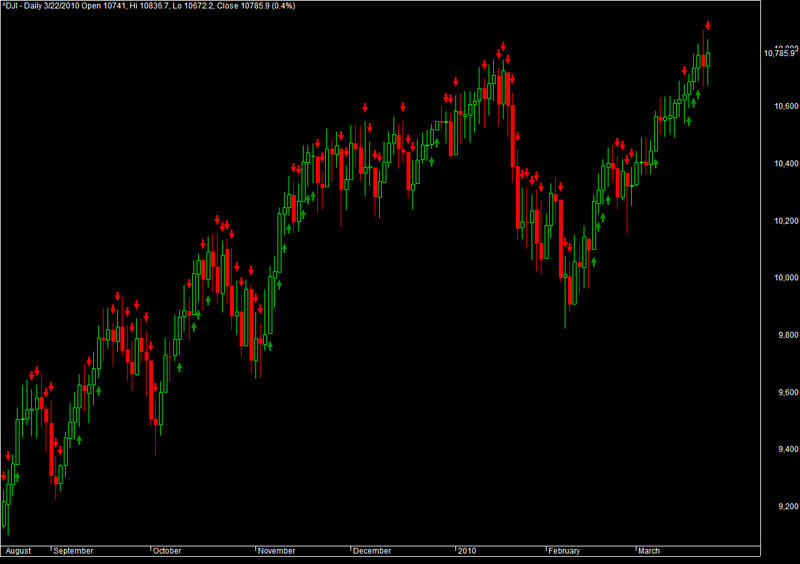
Buy above green and sell below red. This is a fisher transform with EMA system.
Screenshots
Indicator / Formula
Copy & Paste Friendly
_SECTION_BEGIN("EMAavg");
SetChartOptions(0,chartShowArrows|chartShowDates);
_N(Title = StrFormat("{{NAME}} - {{INTERVAL}} {{DATE}} Open %g, Hi %g, Lo %g, Close %g (%.1f%%) {{VALUES}}", O, H, L, C, SelectedValue( ROC( C, 1 ) ) ));
Plot( C, "Close", ParamColor("Color", colorBlack ), styleNoTitle | ParamStyle("Style") | GetPriceStyle() );
z=H;
z1=H+(0.0001*H);

EMAavg1=((21*EMA(z,2))+(13*EMA(z,3))+(8*EMA(z,5))+(5*EMA(z,8))+(3*EMA(z,13))+(2*EMA(z,21)))/(52);
//EMAavg2=(EMA(z1,2)+EMA(z1,3)+EMA(z1,5)+EMA(z1,8)+EMA(z1,13)+EMA(z1,21))/6;

function Normalize(array, arraylen)
// Figure 1.7 on p. 7
{
  MaxH = HHV(array, arraylen);
  MinL = LLV(array, arraylen);
  Value1[0] = array[0];  // Initialize as array

  for(i = 1; i < BarCount; i++)
  {
     Value1[i]=.5*2*((array[i]-MinL[i])/IIf(MaxH[i]-MinL[i]==0,1,MaxH[i]-MinL[i])-.5)+.5*Value1[i-1];
     if (Value1[i] > .9999) Value1[i] = .9999;
     if (Value1[i] < -.9999) Value1[i] = -.9999;
  }
  return Value1;
}

function Fisher(array)
// Figure 1.7 on p. 7
{
  F = array;
  F = .25 * log((1+ array)/(1 - array)) + .5 * Ref(F, -1);
  return F;
}

Med = (H+L)/2;

// Fisher Transform
FisherXform = Fisher(Normalize(Med, 5));
//Plot(FisherXform, "Fisher Transform", colorRed, styleThick);
//Plot(Ref(FisherXform, -1), "", colorBlack, styleDashed);
//PlotGrid(2, colorLightGrey);
//PlotGrid(-2, colorLightGrey);


Buy = C>EMAavg1 AND FisherXform>Ref(FisherXform, -1) AND C>EMA(L,3);
Sell =C<EMAavg1 AND FisherXform<Ref(FisherXform, -1) AND C<EMA(H,3);


PlotShapes(IIf(Sell==1, shapeDownArrow, shapeNone), colorRed, 0,High, Offset=-20);
PlotShapes(IIf(Buy==1, shapeUpArrow , shapeNone), colorGreen, 0,Low, Offset=-20);


//Plot(EMAavg1, StrFormat(_SECTION_NAME()+"(%g)"+",Price=",EMAavg1), colorRed);


_SECTION_END();
1 comments
Leave Comment
Please login here to leave a comment.
So many buy and sell signals it is useless