STOCH MACD+RSI & WILLIAMS+TREND ARROWS for Amibroker (AFL)
B-TA over 15 years ago Amibroker (AFL)
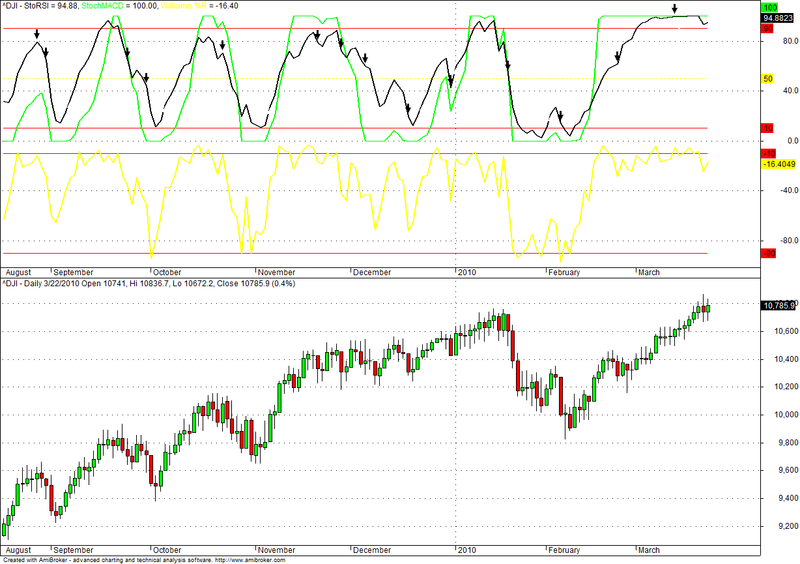
IN ONE PANEL YOU CAN SEE,4 IMPORTANT INDICATOR WITH TREND ARROWS…
Screenshots
Indicator / Formula
Copy & Paste Friendly
_SECTION_BEGIN("STOCHRSI3");

per = Param("Periods", 13, 1, 100);
cctstochrsi = 100*( ( RSI( per ) - LLV( RSI( per ) , per ) ) / ( ( HHV( RSI(
per ) , per ) ) - LLV(RSI( per ), per ) ) );

Plot( cctstochrsi , "StoRSI", colorRed, styleThick);
Plot( EMA(cctstochrsi, 3) , "Signal", colorBlue, styleThick);
Plot(90 , "Signal", colorBlue, styleDashed);
Plot(10 , "Signal", colorBlue, styleDashed);

_SECTION_END();

_SECTION_BEGIN("StochMACD");
StochMACD=100*(MACD()-LLV(MACD(),14))/(HHV(MACD(),14)-LLV(MACD(),14));
Plot(StochMACD,"StochMACD",colorBrightGreen,styleThick);
Plot(90,"",colorRed,styleLine);
Plot(50,"",colorYellow,styleDashed);
Plot(10,"",colorRed,styleLine);

_SECTION_END();

_SECTION_BEGIN("William's +");
R = ((HHV(H,14) - C) /(HHV (H,14) -LLV (L,14))) *-100;
Plot(R, "Williams %R", colorYellow, styleThick,styleOwnScale);
Plot(-10,"",colorRed,styleLine);
Plot(-90,"",colorRed,styleLine);

_SECTION_END();

_SECTION_BEGIN("Trend arrow");
n= Param("No. of Bars",3,2,8,1);
TrendUp = H > Ref(HHV(H,n),-1);
TrendDn = L < Ref(LLV(L,n),-1);
TrendUp = ExRem(TrendUp,TrendDn);
TrendDn = ExRem(TrendDn,TrendUp);
PlotShapes(TrendUp*shapeUpArrow,colorWhite);
PlotShapes(TrendDn*shapeDownArrow,colorBlack);
_SECTION_END();
4 comments
Leave Comment
Please login here to leave a comment.
Cool………….Thanks dear……….I was looking out for how to combine / include 3 to 4 indi in one single panel.
This will help me to improve my trading system work.
Regards,
Prasad Rao.
Excellent one
WOW !! what a wonderful AFL.
Ths a lot
May I request you to add scan for buy and sell arrow, this will help us in finding the stocks, that satisfy the requirement.
Thx in advance.
Brgds
Ravi
Giving error@
Ctmpl = E_TSKPCOLORTMPL (Open,High,Low,Close,Volume); syntax error
total = total + IIf(tskp_colortmplcnd0 > 0, 1, -1);
total = total + IIf(tskp_colortmplcnd1 > 0, 1, -1);
total = total + IIf(tskp_colortmplcnd2 > 0, 1, -1);
total = total + IIf(tskp_colortmplcnd3 > 0, 1, -1);
total = total + IIf(tskp_colortmplcnd4 > 0, 1, -1);
total = total + IIf(tskp_colortmplcnd5 > 0, 1, -1);
total = total + IIf(tskp_colortmplcnd6 > 0, 1, -1);
total = total + IIf(tskp_colortmplcnd7 > 0, 1, -1);
total = total + IIf(tskp_colortmplcnd8 > 0, 1, -1); not intialized
Combo = E_TSKPCOMBO(Open,High,Low,Close,Volume); syntax error
i would be grateful if some one help me to set it right. I’m using 5.50 amibroker