Fundamental data viewer for Amibroker (AFL)
reaz over 15 years ago Amibroker (AFL)
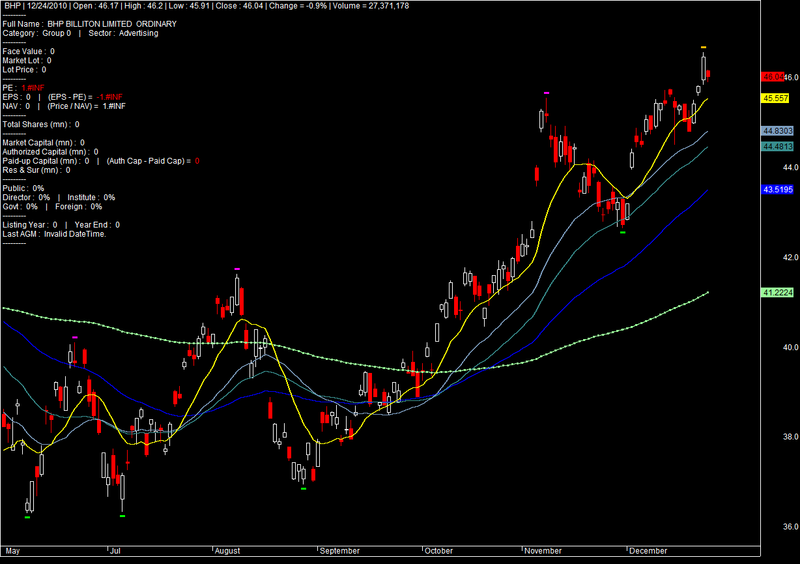
Many many thanks Pavel bro who created it and share with us.. Funda analysis of any share.
Screenshots
Indicator / Formula
Copy & Paste Friendly
SetChartOptions(0,chartShowArrows|chartShowDates);

_SECTION_BEGIN("Background_Setting");
SetChartBkGradientFill( ParamColor("BgTop", colorBlack),ParamColor("BgBottom", colorBlack),ParamColor("TitleBlock",colorBlack ));
_SECTION_END();

_SECTION_BEGIN("Average 1");
//Average_switch = ParamToggle("Candle On/off", "Off|On");
P = ParamField("Field");
Type = ParamList("Type", "Weighted,Lagless-21,Hull-26,Linear
Regression-45,Exponential,Double Exponential,Tripple
Exponential,Wilders,Simple");
Periods = Param("Periods", 15, 2, 200 );
Displacement = Param("Displacement", 1, -50, 50 );
m = 0;

if( Type == "Weighted" ) 				m=  WMA( P, Periods );
if( Type == "Lagless-21"  )				m=  2*EMA(P, Periods)-EMA(EMA(P, Periods),
Periods);
if( Type == "Hull-26"  )				m=  WMA(2*(WMA(P, Periods/2))-WMA(P, Periods) ,4
);
if( Type == "Linear Regression-45"  ) m=  LinearReg( P, Periods );
if( Type == "Exponential" ) 			m = EMA( P, Periods );
if( Type == "Double Exponential" ) 	m = DEMA( P, Periods );
if( Type == "Tripple Exponential" ) 	m = TEMA( P, Periods );
if( Type == "Wilders" ) 				m = Wilders( P, Periods );
if( Type == "Simple" ) 					m = MA( P, Periods );

Plot( m, _DEFAULT_NAME(), ParamColor("Color", colorYellow),ParamStyle("Style",styleLine |styleThick|styleNoTitle ,maskAll),Displacement );

_SECTION_END();

_SECTION_BEGIN("Average 2");
P = ParamField("Field");
Type = ParamList("Type", "Weighted,Lagless-21,Hull-26,Linear
Regression-45,Exponential,Double Exponential,Tripple
Exponential,Wilders,Simple");
Periods = Param("Periods", 35 ,2, 200 );
Displacement = Param("Displacement", 1, -50, 50 );
m = 0;

if( Type == "Weighted" ) 				m=  WMA( P, Periods );
if( Type == "Lagless-21"  )				m=  2*EMA(P, Periods)-EMA(EMA(P, Periods),
Periods);
if( Type == "Hull-26"  )				m=  WMA(2*(WMA(P, Periods/2))-WMA(P, Periods) ,4
);
if( Type == "Linear Regression-45"  ) m=  LinearReg( P, Periods );
if( Type == "Exponential" ) 			m = EMA( P, Periods );
if( Type == "Double Exponential" ) 	m = DEMA( P, Periods );
if( Type == "Tripple Exponential" ) 	m = TEMA( P, Periods );
if( Type == "Wilders" ) 				m = Wilders( P, Periods );
if( Type == "Simple" ) 					m = MA( P, Periods );

Plot( m, _DEFAULT_NAME(), ParamColor("Color", colorLightBlue),ParamStyle("Style",styleLine |styleThick|styleNoTitle ,maskAll),Displacement );
_SECTION_END();

_SECTION_BEGIN("Average 5");
P = ParamField("Field");
Type = ParamList("Type", "Weighted,Lagless-21,Hull-26,Linear
Regression-45,Exponential,Double Exponential,Tripple
Exponential,Wilders,Simple");
Periods = Param("Periods", 50 ,2, 200 );
Displacement = Param("Displacement", 1, -50, 50 );
m = 0;

if( Type == "Weighted" ) 				m=  WMA( P, Periods );
if( Type == "Lagless-21"  )				m=  2*EMA(P, Periods)-EMA(EMA(P, Periods),
Periods);
if( Type == "Hull-26"  )				m=  WMA(2*(WMA(P, Periods/2))-WMA(P, Periods) ,4
);
if( Type == "Linear Regression-45"  ) m=  LinearReg( P, Periods );
if( Type == "Exponential" ) 			m = EMA( P, Periods );
if( Type == "Double Exponential" ) 	m = DEMA( P, Periods );
if( Type == "Tripple Exponential" ) 	m = TEMA( P, Periods );
if( Type == "Wilders" ) 				m = Wilders( P, Periods );
if( Type == "Simple" ) 					m = MA( P, Periods );

Plot( m, _DEFAULT_NAME(), ParamColor("Color", colorTeal),ParamStyle("Style",styleLine |styleThick|styleNoTitle ,maskAll),Displacement );
_SECTION_END();


_SECTION_BEGIN("Sell Average 3");
P = ParamField("Field");
Type = ParamList("Type", "Weighted,Lagless-21,Hull-26,Linear
Regression-45,Exponential,Double Exponential,Tripple
Exponential,Wilders,Simple");
Periods = Param("Periods", 80, 2, 200 );
Displacement = Param("Displacement", 1, -50, 50 );
m = 0;

if( Type == "Weighted" ) 				m=  WMA( P, Periods );
if( Type == "Lagless-21"  )				m=  2*EMA(P, Periods)-EMA(EMA(P, Periods),
Periods);
if( Type == "Hull-26"  )				m=  WMA(2*(WMA(P, Periods/2))-WMA(P, Periods) ,4
);
if( Type == "Linear Regression-45"  ) m=  LinearReg( P, Periods );
if( Type == "Exponential" ) 			m = EMA( P, Periods );
if( Type == "Double Exponential" ) 	m = DEMA( P, Periods );
if( Type == "Tripple Exponential" ) 	m = TEMA( P, Periods );
if( Type == "Wilders" ) 				m = Wilders( P, Periods );
if( Type == "Simple" ) 					m = MA( P, Periods );

Plot( m, _DEFAULT_NAME(), ParamColor("Color", colorBlue),ParamStyle("Style",styleLine |styleThick|styleNoTitle ,maskAll),Displacement );
_SECTION_END();


_SECTION_BEGIN("Average 4");
P = ParamField("Field");
Type = ParamList("Type", "Weighted,Lagless-21,Hull-26,Linear
Regression-45,Exponential,Double Exponential,Tripple
Exponential,Wilders,Simple");
Periods = Param("Periods", 200, 2, 200 );
Displacement = Param("Displacement", 1, -50, 50 );
m = 0;

if( Type == "Weighted" ) 				m=  WMA( P, Periods );
if( Type == "Lagless-21"  )				m=  2*EMA(P, Periods)-EMA(EMA(P, Periods),
Periods);
if( Type == "Hull-26"  )				m=  WMA(2*(WMA(P, Periods/2))-WMA(P, Periods) ,4
);
if( Type == "Linear Regression-45"  ) m=  LinearReg( P, Periods );
if( Type == "Exponential" ) 			m = EMA( P, Periods );
if( Type == "Double Exponential" ) 	m = DEMA( P, Periods );
if( Type == "Tripple Exponential" ) 	m = TEMA( P, Periods );

Plot( m, _DEFAULT_NAME(), ParamColor("Color", colorPaleGreen),ParamStyle("Style",styleLine |styleThick|styleDots|styleNoTitle ,maskAll),Displacement );
_SECTION_END();

_SECTION_BEGIN("Pivot");
nBars = Param("Number of bars", 15, 5, 40);
LP=Param("LookBack Period",250,1,500,1);
bShowTCZ = Param("Show TCZ", 0, 0, 1);
nExploreBarIdx = 0;
nExploreDate = 0;
nCurDateNum = 0;
DN = DateNum();
DT = DateTime();
bTCZLong = False;
bTCZShort = False;
nAnchorPivIdx = 0;
ADX8 = ADX(8);
if(Status("action")==1) {
	bDraw = True;
	bUseLastVis = 1;
} else {
	bDraw = False;
	bUseLastVis = False;
	bTrace = 1;
	nExploreDate = Status("rangetodate");
	for (i=LastValue(BarIndex());i>=0;i--) {
		nCurDateNum = DN[i];
		if (nCurDateNum == nExploreDate) {
			nExploreBarIdx = i;
		}
	}
}
GraphXSpace=7;
if (bDraw) {
}
aHPivs = H - H;
aLPivs = L - L;
aHPivHighs = H - H;
aLPivLows = L - L;
aHPivIdxs = H - H;
aLPivIdxs = L - L;
aAddedHPivs = H - H;
aAddedLPivs = L - L;
aLegVol = H - H;
aRetrcVol = H - H;
nHPivs = 0;
nLPivs = 0;
lastHPIdx = 0;
lastLPIdx = 0;
lastHPH = 0;
lastLPL = 0;
curPivBarIdx = 0;
aHHVBars = HHVBars(H, nBars);
aLLVBars = LLVBars(L, nBars);
aHHV = HHV(H, nBars);
aLLV = LLV(L, nBars);
nLastVisBar = LastValue(
	Highest(IIf(Status("barvisible"), BarIndex(), 0)));
curBar = IIf(nlastVisBar > 0 AND bUseLastVis, nlastVisBar,
	IIf(Status("action")==4 AND nExploreBarIdx > 0, nExploreBarIdx,
	LastValue(BarIndex())));
curTrend = "";
if (aLLVBars[curBar] < aHHVBars[curBar])
	curTrend = "D";
else
	curTrend = "U";
if (curBar >= LP) {
	for (i=0; i<LP; i++) {
		curBar = IIf(nlastVisBar > 0 AND bUseLastVis,
			nlastVisBar-i,
			IIf(Status("action")==4 AND nExploreBarIdx > 0,
			nExploreBarIdx-i,
			LastValue(BarIndex())-i));
		if (aLLVBars[curBar] < aHHVBars[curBar]) {
			if (curTrend == "U") {
				curTrend = "D";
				curPivBarIdx = curBar - aLLVBars[curBar];
				aLPivs[curPivBarIdx] = 1;
				aLPivLows[nLPivs] = L[curPivBarIdx];
				aLPivIdxs[nLPivs] = curPivBarIdx;
				nLPivs++;
			}
		} else {
			if (curTrend == "D") {
				curTrend = "U";
				curPivBarIdx = curBar - aHHVBars[curBar];
				aHPivs[curPivBarIdx] = 1;
				aHPivHighs[nHPivs] = H[curPivBarIdx];
				aHPivIdxs[nHPivs] = curPivBarIdx;
				nHPivs++;
			}
		}
	}
}
curBar =
	IIf(nlastVisBar > 0 AND bUseLastVis,
	nlastVisBar,
	IIf(Status("action")==4 AND nExploreBarIdx > 0,
	nExploreBarIdx,
	LastValue(BarIndex()))
	);
if (nHPivs >= 2 AND nLPivs >= 2) {
	lastLPIdx = aLPivIdxs[0];
	lastLPL = aLPivLows[0];
	lastHPIdx = aHPivIdxs[0];
	lastHPH = aHPivHighs[0];
	nLastHOrLPivIdx = Max(lastLPIdx, lastHPIdx);
	nAddPivsRng = curBar - nLastHOrLPivIdx;
	aLLVAfterLastPiv = LLV(L, nAddPivsRng);
	nLLVAfterLastPiv = aLLVAfterLastPiv[curBar];
	aLLVIdxAfterLastPiv = LLVBars(L, nAddPivsRng);
	nLLVIdxAfterLastPiv = curBar - aLLVIdxAfterLastPiv[curBar];
	aHHVAfterLastPiv = HHV(H, nAddPivsRng);
	nHHVAfterLastPiv = aHHVAfterLastPiv[curBar];
	aHHVIdxAfterLastPiv = HHVBars(H, nAddPivsRng);
	nHHVIdxAfterLastPiv = curBar - aHHVIdxAfterLastPiv[curBar];
	if (lastHPIdx > lastLPIdx) {

		/*	There are at least two possibilities here. One is that
	   		the previous high was higher, indicating that this is a
	   		possible short retracement or one in the making.
	   		The other is that the previous high was lower, indicating
	   		that this is a possible long retracement in the working.
			However, both depend on opposing pivots. E.g., if I find
			higher highs, what if I have lower lows?

			If the highs are descending, then I can consider:
	   			- a lower low, and leave it at that
	   			- a higher high and higher low
	   			- a lower low and another lower high
		*/
		if (aHPivHighs[0] < aHPivHighs[1]) {

			if (nLLVAfterLastPiv < aLPivLows[0] AND
				(nLLVIdxAfterLastPiv - lastHPIdx - 1) >= 1
				AND nLLVIdxAfterLastPiv != curBar	) {

				// -- OK, we'll add this as a pivot.
				//    Mark it for plotting...
				aLPivs[nLLVIdxAfterLastPiv] = 1;
				aAddedLPivs[nLLVIdxAfterLastPiv] = 1;

				//    ...and then rearrange elements in the
				//    pivot information arrays
				for (j=0; j<nLPivs; j++) {
					aLPivLows[nLPivs-j] = aLPivLows[nLPivs-(j+1)];
					aLPivIdxs[nLPivs-j] = aLPivIdxs[nLPivs-(j+1)];
				}
				aLPivLows[0] = nLLVAfterLastPiv;
				aLPivIdxs[0] = nLLVIdxAfterLastPiv;
				nLPivs++;

			// -- Test whether to add piv given last piv is high
			//    AND we have lower highs
			}

		// -- Here, the last piv is a high piv, and we have
		//    higher-highs. The most likely addition is a
		//    Low piv that is a retracement.
		} else {

			if (nLLVAfterLastPiv > aLPivLows[0] AND
				(nLLVIdxAfterLastPiv - lastHPIdx - 1) >= 1
				AND nLLVIdxAfterLastPiv != curBar	) {

				// -- OK, we'll add this as a pivot.
				//    Mark it for plotting...
				aLPivs[nLLVIdxAfterLastPiv] = 1;
				aAddedLPivs[nLLVIdxAfterLastPiv] = 1;

				//    ...and then rearrange elements in the
				//    pivot information arrays
				for (j=0; j<nLPivs; j++) {
					aLPivLows[nLPivs-j] = aLPivLows[nLPivs-(j+1)];
					aLPivIdxs[nLPivs-j] = aLPivIdxs[nLPivs-(j+1)];
				}
				aLPivLows[0] = nLLVAfterLastPiv;
				aLPivIdxs[0] = nLLVIdxAfterLastPiv;
				nLPivs++;

			// -- Test whether to add piv given last piv is high
			//    AND we have lower highs
			}
		// -- The last piv is a high and we have higher highs
		//    OR lower highs
		}

	/* ****************************************************************
		Still finding missed pivot(s). Here, the last piv is a low piv.
	**************************************************************** */
	} else {

		// -- First case, lower highs
		if (aHPivHighs[0] < aHPivHighs[1]) {

			if (nHHVAfterLastPiv < aHPivHighs[0] AND
				(nHHVIdxAfterLastPiv - lastLPIdx - 1) >= 1
				AND nHHVIdxAfterLastPiv != curBar	) {

				// -- OK, we'll add this as a pivot.
				//    Mark that for plotting
				aHPivs[nHHVIdxAfterLastPiv] = 1;
				aAddedHPivs[nHHVIdxAfterLastPiv] = 1;

				//    ...and then rearrange elements in the
				//    pivot information arrays
				for (j=0; j<nHPivs; j++) {
					aHPivHighs[nHPivs-j] = aHPivHighs[nHPivs-(j+1)];
					aHPivIdxs[nHPivs-j] = aHPivIdxs[nhPivs-(j+1)];
				}
				aHPivHighs[0] = nHHVAfterLastPiv;
				aHPivIdxs[0] = nHHVIdxAfterLastPiv;
				nHPivs++;

			// -- Test whether to add piv given last piv is high
			//    AND we have lower highs
			}

		// -- Second case when last piv is a low piv, higher highs
		//    Most likely addition is high piv that is a retracement.
		//    Considering adding a high piv as long as it is higher
		} else {

			// -- Where I have higher highs,
			if (nHHVAfterLastPiv > aHPivHighs[0] AND
				(nHHVIdxAfterLastPiv - lastLPIdx - 1) >= 1
				AND nHHVIdxAfterLastPiv != curBar	) {

				// -- OK, we'll add this as a pivot.
				//    Mark it for plotting...
				aHPivs[nHHVIdxAfterLastPiv] = 1;
				aAddedHPivs[nHHVIdxAfterLastPiv] = 1;

				//    ...and then rearrange elements in the
				//    pivot information arrays
				for (j=0; j<nHPivs; j++) {
					aHPivHighs[nHPivs-j] = aHPivHighs[nHPivs-(j+1)];
					aHPivIdxs[nHPivs-j] = aHPivIdxs[nhPivs-(j+1)];
				}
				aHPivHighs[0] = nHHVAfterLastPiv;
				aHPivIdxs[0] = nHHVIdxAfterLastPiv;
				nHPivs++;

			// -- Test whether to add piv given last piv is high
			//    AND we have lower highs
			}

		}

	}

// -- If there are at least two of each
}

/* ****************************************
// -- Done with finding pivots
***************************************** */

if (bDraw) {

	// -- OK, let's plot the pivots using arrows


PlotShapes( IIf(aHPivs==1, shapeSmallSquare, shapeNone), colorCustom12, layer = 0, yposition = High, offset = 9);
PlotShapes( IIf(aHPivs==1, shapeSmallSquare, shapeNone), colorBlack, layer = 0, yposition = High, offset = 12);

PlotShapes( IIf(aAddedHPivs==1, shapeSmallSquare, shapeNone), colorCustom10,layer = 0, yposition = High, offset = 9);
PlotShapes( IIf(aAddedHPivs==1, shapeSmallSquare, shapeNone), colorBlack, layer = 0, yposition = High, offset = 12);

PlotShapes( IIf(aLPivs==1, shapeSmallSquare, shapeNone), colorBrightGreen, layer = 0, yposition = Low, offset = -9);
PlotShapes( IIf(aLPivs==1, shapeSmallSquare, shapeNone), colorBlack, layer = 0, yposition = Low, offset = -12);

PlotShapes( IIf(aAddedLPivs==1, shapeSmallSquare, shapeNone), colorYellow, layer = 0, yposition = Low, offset = -10);
PlotShapes( IIf(aAddedLPivs==1, shapeSmallSquare, shapeNone), colorBlack, layer = 0, yposition = Low, offset = -13);
}


/* ****************************************
// -- Done with discovering and plotting pivots
***************************************** */

// -- I'm going to want to look for possible retracement
risk = 0;
profInc = 0;
nLeg0Pts = 0;
nLeg0Bars = 0;
nLeg0Vol = 0;
nLeg1Pts = 0;
nLeg1Bars = 0;
nLeg1Vol = 0;
nLegBarsDiff = 0;
nRtrc0Pts = 0;
nRtrc0Bars = 0;
nRtrc0Vol = 0;
nRtrc1Pts = 0;
nRtrc1Bars = 0;
nRtrc1Vol = 0;

minRtrc = 0;
maxRtrc = 0;
minLine = 0;
maxLine = 0;
triggerLine = 0;
firstProfitLine = 0;
triggerInc = 0;
triggerPrc = 0;
firstProfitPrc = 0;
retrcPrc = 0;
retrcBar = 0;
retrcBarIdx = 0;
retrcRng = 0;
aRetrcPrc = H-H;
aRetrcPrcBars = H-H;
aRetrcClose = C;
retrcClose = 0;

// -- Do TCZ calcs. Arrangement of pivs very specific
//    for this setup.
if (nHPivs >= 2 AND
	nLPivs >=2 AND
	aHPivHighs[0] > aHPivHighs[1] AND
	aLPivLows[0] > aLPivLows[1]) {

	tcz500 =
	(aHPivHighs[0] -
	(.5 * (aHPivHighs[0] - aLPivLows[1])));

	tcz618 =
	(aHPivHighs[0] -
	(.618 * (aHPivHighs[0] - aLPivLows[1])));

	tcz786 =
	(aHPivHighs[0] -
	(.786 * (aHPivHighs[0] - aLPivLows[0])));

	retrcRng = curBar  - aHPivIdxs[0];
	aRetrcPrc = LLV(L, retrcRng);
	aRetrcPrcBars  = LLVBars(L, retrcRng);

	retrcPrc = aRetrcPrc[curBar];
	retrcBarIdx = curBar - aRetrcPrcBars[curBar];
	retrcClose = aRetrcClose[retrcBarIdx];

	// -- bTCZLong setup?
	bTCZLong = (

		// -- Are retracement levels arranged in
		//    tcz order?

		// .500 is above .786 for long setups
		tcz500 >= (tcz786 * (1 - .005))
		AND
		// .681 is below .786 for long setups
		tcz618 <= (tcz786 * (1 + .005))
		AND

		// -- Is the low in the tcz range
		// -- Is the close >= low of tcz range
		//    and low <= high of tcz range
		retrcClose >= ((1 - .01) *  tcz618)
		AND
		retrcPrc <= ((1 + .01) *  tcz500)
		);

		// -- risk would be high of signal bar minus low of zone
		//risk = 0;

// -- lower highs and lower lows
} else if (nHPivs >= 2 AND nLPivs >=2
	AND aHPivHighs[0] < aHPivHighs[1]
	AND aLPivLows[0] < aLPivLows[1]) {

	tcz500 =
	(aHPivHighs[1] -
	(.5 * (aHPivHighs[1] - aLPivLows[0])));

	tcz618 =
	(aHPivHighs[0] -
	(.618 * (aHPivHighs[1] - aLPivLows[0])));

	tcz786 =
	(aHPivHighs[0] -
	(.786 * (aHPivHighs[0] - aLPivLows[0])));

	retrcRng = curBar  - aLPivIdxs[0];
	aRetrcPrc = HHV(H, retrcRng);
	retrcPrc = aRetrcPrc[curBar];
	aRetrcPrcBars  = HHVBars(H, retrcRng);
	retrcBarIdx = curBar - aRetrcPrcBars[curBar];
	retrcClose = aRetrcClose[retrcBarIdx];

	bTCZShort = (
		// -- Are retracement levels arranged in
		//    tcz order?

		// .500 is below .786 for short setups
		tcz500 <= (tcz786 * (1 + .005))
		AND
		// .681 is above .786 for short setups
		tcz618 >= (tcz786 * (1 - .005))
		AND

		// -- Is the close <= high of tcz range
		//    and high >= low of tcz range
		retrcClose <= ((1 + .01) *  tcz618)
		AND
		retrcPrc >= ((1 - .01) *  tcz500)
		);

		// -- Risk would be top of zone - low of signal bar
		//risk = 0;
}

// -- Show zone if present
if (bTCZShort OR bTCZLong) {

	// -- Be prepared to see symmetry
	if (bTCZShort) {
		if (aLPivIdxs[0] > aHPivIdxs[0]) {
			// -- Valuable, useful symmetry information
			nRtrc0Pts = aHPivHighs[0] - aLPivLows[1];
			nRtrc0Bars = aHPivIdxs[0] - aLPivIdxs[1] + 1;
			nRtrc1Pts = retrcPrc - aLPivLows[0];
			nRtrc1Bars = retrcBarIdx - aLPivIdxs[0] + 1;
		} else {
			nRtrc0Pts = aHPivHighs[1] - aLPivLows[1];
			nRtrc0Bars = aHPivIdxs[1] - aLPivIdxs[1] + 1;
			nRtrc1Pts = aHPivHighs[0] - aLPivLows[0];
			nRtrc1Bars = aHPivIdxs[0] - aLPivIdxs[0] + 1;
		}
	} else { // bLongSetup
		if (aLPivIdxs[0] > aHPivIdxs[0]) {
			nRtrc0Pts = aHPivHighs[0] - aLPivLows[1];
			nRtrc0Bars = aHPivIdxs[0] - aLPivIdxs[1] + 1;
			nRtrc1Pts = retrcPrc - aLPivLows[0];
			nRtrc1Bars = retrcBarIdx - aLPivIdxs[0] + 1;
		} else {
			nRtrc0Pts = aHPivHighs[1] - aLPivLows[0];
			nRtrc0Bars = aLPivIdxs[0] - aHPivIdxs[1] + 1;
			nRtrc1Pts = aHPivHighs[0] - aLPivLows[0];
			nRtrc1Bars = aLPivIdxs[0] - aHPivIdxs[0] + 1;
		}
	}

	if (bShowTCZ) {
		Plot(
			LineArray(	IIf(bTCZLong, aHPivIdxs[0], aLPivIdxs[0]),
			tcz500, curBar, tcz500 , 0),
			"tcz500", colorPaleBlue, styleLine);
		Plot(
			LineArray(	IIf(bTCZLong, aHPivIdxs[0], aLPivIdxs[0]),
			tcz618, curBar, tcz618, 0),
			"tcz618", colorPaleBlue, styleLine);
		Plot(
			LineArray(	IIf(bTCZLong, aHPivIdxs[0], aLPivIdxs[0]),
			tcz786, curBar, tcz786, 0),
			"tcz786", colorTurquoise, styleLine);
	}

// -- if (bShowTCZ)
}


// **************************
// END INDICATOR CODE
// **************************
_SECTION_END();

_SECTION_BEGIN("Taifur's Fundamental Viewer 2011");

//// First Part : DATA ////
FaceValue=GetFnData("BookValuePerShare"); //// Face Value
Lot=GetFnData("sharesshortprevmonth"); //// Market Lot
LotPrice= (Lot * C); //// Lot Price
TotalShares=GetFnData("SharesOut")/ 1000000; //// Total Shares
EPS=GetFnData("EPS"); //// EPS
PE=C/EPS; //// PE Basic
DiffPEEPS=EPS-PE; //// Whether PE is less than EPS
NAV=GetFnData("PEGRatio"); //// NAV
PriceNAV=C/NAV; //// Price / NAV
////MarketCapital=GetFnData("SharesOut") * C / 1000000; //// Market Capital
MarketCapital=GetFnData("SharesOut")*Ref(C,-1)/ 1000000; //// Market Capital
AuthorizedCapital=GetFnData("ForwardDividendPerShare"); //// Authorized Capital
PaidCap=GetFnData("ReturnOnAssets"); //// Paid-Up Capital
DiffAuthCapPaidCap=AuthorizedCapital-PaidCap;
ResSur=GetFnData ("ForwardEPS"); //// Res & Sur
ListingYear=GetFnData("Beta"); //// Listing Year
Director=GetFnData("InsiderHoldPercent"); //// Director Holdings
Govt = GetFnData("SharesShort"); //// Government Holdings
Institute= GetFnData("InstitutionHoldPercent"); //// Institute Holdings
Foriegn = GetFnData("OperatingCashFlow"); //// Foreign Holdings
Public=GetFnData("sharesfloat"); //// Public Shares
AGM=DateTimeToStr(GetFnData("DividendPayDate")); //// Last AGM Date
YearEnd=GetFnData("OperatingMargin");//// Year END

//// Second Part : TEXT ////
Plot (Close,"", IIf( C > O, ParamColor("Up Color", colorWhite ), ParamColor("Down Color", colorRed )),ParamStyle( "Style", styleCandle | styleThick, maskAll));
Title = StrFormat("\\c02 {{NAME}} | {{DATE}} | Open : %g | High : %g | Low : %g | Close : %g | Change = %.1f%% | Volume = " +WriteVal( V, 1.0 ) +" {{VALUES}}",O, H, L, C, SelectedValue( ROC( C, 1 )) )
+"\n"+EncodeColor(colorWhite)+"--------- "
+"\n"+EncodeColor(colorWhite)+"Full Name :  " +FullName()
+"\n"+EncodeColor(colorWhite)+"Category :  " +GroupID(1) + "    |    " +EncodeColor(colorWhite)+"Sector :  " +IndustryID(1) + "     "
+"\n"+EncodeColor(colorWhite)+"---------"
+"\n"+EncodeColor(colorWhite)+"Face Value :  " +FaceValue + "     "
+"\n"+EncodeColor(colorWhite)+"Market Lot :  " +Lot + "     "
+"\n"+EncodeColor(colorWhite)+"Lot Price :  " + LotPrice + "     "
+"\n"+EncodeColor(colorWhite)+"---------"
+"\n"+EncodeColor(colorWhite)+"PE :  " +WriteIf(PE>40,EncodeColor(colorRed),EncodeColor(colorBrightGreen)) +PE + "     "
+"\n"+EncodeColor(colorWhite)+"EPS :  " +EPS + "    |    " +EncodeColor(colorWhite)+"(EPS - PE) =  " +WriteIf(DiffPEEPS>0,EncodeColor(colorBrightGreen),EncodeColor(colorRed)) +DiffPEEPS +"  "
+"\n"+EncodeColor(colorWhite)+"NAV :  " +NAV + "    |    " +EncodeColor(colorWhite)+"(Price / NAV) =  " +PriceNAV +"  "
+"\n"+EncodeColor(colorWhite)+"---------"
+"\n"+EncodeColor(colorWhite)+"Total Shares (mn) :  " +TotalShares + "     "
+"\n"+EncodeColor(colorWhite)+"---------"
+"\n"+EncodeColor(colorWhite)+"Market Capital (mn) :  " +MarketCapital + "     "
+"\n"+EncodeColor(colorWhite)+"Authorized Capital (mn) :  " +AuthorizedCapital + "                                                                    "
+"\n"+EncodeColor(colorWhite)+"Paid-up Capital (mn) :  " +PaidCap + "    |    " +EncodeColor(colorWhite)+"(Auth Cap - Paid Cap) =  " +WriteIf(DiffAuthCapPaidCap>0,EncodeColor(colorBrightGreen),EncodeColor(colorRed)) +DiffAuthCapPaidCap +"  "
+"\n"+EncodeColor(colorWhite)+"Res & Sur (mn) :  " +ResSur + "                                                                               "
+"\n"+EncodeColor(colorWhite)+"---------"
+"\n"+EncodeColor(colorWhite)+"Public :  " + Public +"%" + "     "
+"\n"+EncodeColor(colorWhite)+"Director :  " +Director +"%" + "    |    " +EncodeColor(colorWhite)+"Institute :  " +Institute +"%" + "     "
+"\n"+EncodeColor(colorWhite)+"Govt :  " +Govt +"%" + "    |    " +EncodeColor(colorWhite)+"Foreign :  " +Foriegn +"%" + "     "
+"\n"+EncodeColor(colorWhite)+"---------"
+"\n"+EncodeColor(colorWhite)+"Listing Year :  " +ListingYear + "    |    " +EncodeColor(colorWhite)+"Year End :  " + YearEnd + "     "
+"\n"+EncodeColor(colorWhite)+"Last AGM :  " + AGM + "     "
+"\n"+EncodeColor(colorWhite)+"---------"
+"\n"+EncodeColor(colorWhite)+ NoteGet ("")
;

//// Second Part : EXPLORATION ////
LastBar = Cum( 1 ) == LastValue( Cum( 1 ) );
Filter = LastBar;
AddColumn (Close,"Close Price",format = 1.2);
AddColumn (FaceValue,"Face Value",format = 1.0);
AddColumn (Lot,"Market Lot",format = 1.0);
AddColumn (LotPrice,"Lot Price",format = 1.0);
AddColumn (TotalShares,"Total Shares (mn)",format = 1.5);
AddColumn (EPS,"EPS",format = 1.2);
AddColumn (PE,"PE",format = 1.2);
AddColumn (DiffPEEPS,"EPS - PE",format = 1.2); //// Whether PE is less than EPS
AddColumn (NAV,"NAV",format = 1.2);
AddColumn (PriceNAV,"Price / NAV",format = 1.3);
AddColumn (TotalShares,"Total No of Shares (mn)",format = 1.0);
AddColumn (MarketCapital,"Market Cap (mn)",format = 1.0);
AddColumn (AuthorizedCapital,"Auth Cap",format = 1.0);
AddColumn (PaidCap,"Paid-up Cap",format = 1.0);
AddColumn (DiffAuthCapPaidCap,"Auth - Paid",format = 1.2); //// Difference between Auth Cap and Paid-up Cap
AddColumn (ResSur,"Res & Sur",format = 1.0);
AddColumn (Public,"Public %",format = 1.2);
AddColumn (Director,"Director %",format = 1.2);
AddColumn (institute,"Institute %",format = 1.0);
AddColumn (Govt, "Govt %",format = 1.0);
AddColumn (foriegn,"Foreign %",format = 1.0);
AddColumn (YearEnd,"Year End",format = 1);
_SECTION_END();
9 comments
Leave Comment
Please login here to leave a comment.
your afl is good but from where we get the fundamental data for individual stock? please tell me the source.
and also the procedure to update the data in to the software.
bro, where can we get the fundamental data for dse? how to import those data?
Hmmmmmm …
pls tell me sir how to get fundamental data mr. admin pls expain how to get fundamental data in chart
all data come zero as you showned in chart
explain the procedur
u need to extract Funda Data in a Excell file with required heads, import the data through ASCII into Symbol Information Data Fields of AB
details instr is written in AB user manual …
http://www.amibroker.com/guide/h_fundamental.html
Sir where is Funda Data in a Excel file.
Have New Fundamental View Mr Taifur ?. Thanks