Spearman Indicator for Amibroker (AFL)
konidena over 15 years ago Amibroker (AFL)
From S& C Mag February 2011
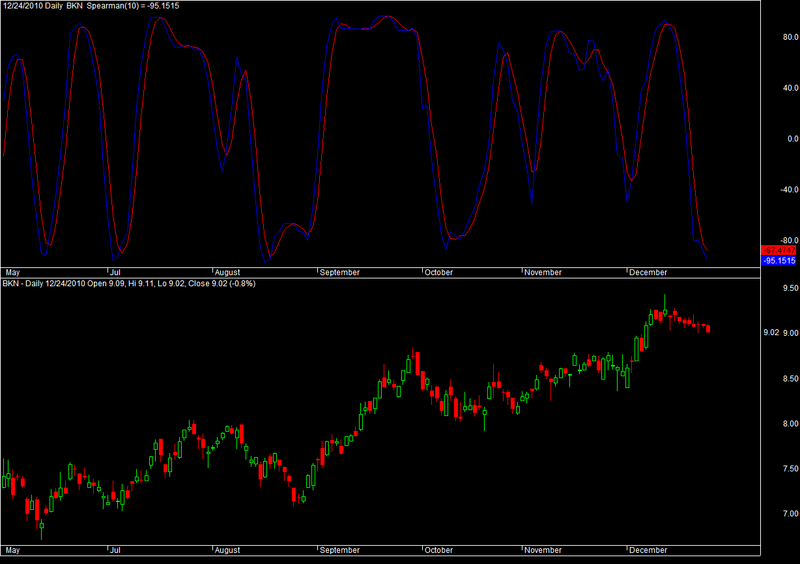
It may be possible to use the Spearman coefficient to determine trend intensity AND turning points. I wrote a program using AmiBroker to calculate this indicator (see below).
Screenshots
Indicator / Formula
Copy & Paste Friendly
// Spearman indicator:
//
// r1  - time series order
// r11 - price (close)
// r21 - internal sort table
// r22 - order of prices (close)
// This code has been written only to support findings
// described in this article. It can be modified for
// improved efficency.
//
/* Number of periods */
n = Param("Periods: ", 10, 5, 200, 1 );

/* Start loop and computations based on Close */

for( k = n; k <= BarCount-1; k++ )

/* Populate internal tables for n elements */

	{
		r1=0; r11 = 0; r2=0; r21=0; r22=0;
///////////////////////////////////////////////////////////////
  		for(i=n; i>=1; i--)

		{
			r1[i]  = i;
			r22[i] = i;

			r11[i] = Close[k-n+i];
			r21[i] = Close[k-n+i];
		}  // for ...
///////////////////////////////////////////////////////////////
/* Sort internal table r21 descending */

		changed = 1;
		while(changed > 0)
		{
			changed = 0;
      		for(i=1; i<=(n-1); i++)
			{
				if(r21[i+1]<r21[i])
				{
					temp = r21[i];
					r21[i] = r21[i+1];
					r21[i+1] = temp;
					changed = 1;
				}
			}   // for ....

		}   //  while ....
///////////////////////////////////////////////////////////////
      	for(i =1; i<=n; i++)

		{
			found = 0;
			while(found < 1)
			{
				for(j =1; j<=n; j++)
				{
					if(r21[j] == r11[i])

					{
							r22[i] = j;
							found = 1;
					}

				} // for ...
			 }  // while ...

		}   // for ...
///////////////////////////////////////////////////////////////

/* Compute Spearman's rank correlation coeficient for n bars */

		absum=0;

             for(i = 1; i<=n; i++)

		{
			ab   = r1[i] - r22[i];
			ab2 = ab*ab;
			absum = absum+ab2;

		} // for ...

		coefcorr[k] = (1-(6*absum)/(n*(n*n-1)));

/* coefcorr[k]: Spearman's rank correlation coefficient for current bar k */

	sc[k]=100*coefcorr[k];   // multiplied by 100

///////////////////////////////////////////////////////////////

}  // for k.....

//

/* Plot Spearman's rank correlation coefficient multiplied by 100 */

Plot(sc, "Spearman indicator", colorBlue, styleLine);

/* Plot 3-bar simple moving average */

Plot(MA(sc,3), "SMA(3)", colorRed, styleLine);

Title = Date()+ " " + Interval(2) +"  "+  Name()  +"  Spearman("+n+") = " + sc;

/*  end */
1 comments
Leave Comment
Please login here to leave a comment.
NICE AFL ,CAN ANY ONE ADD BUY & SELL
WHEN BLUE LINE CROSSES RED .
THANKS IN ADVANCE.