trend and sideways indicator for Amibroker (AFL)
drbsrini over 15 years ago Amibroker (AFL)
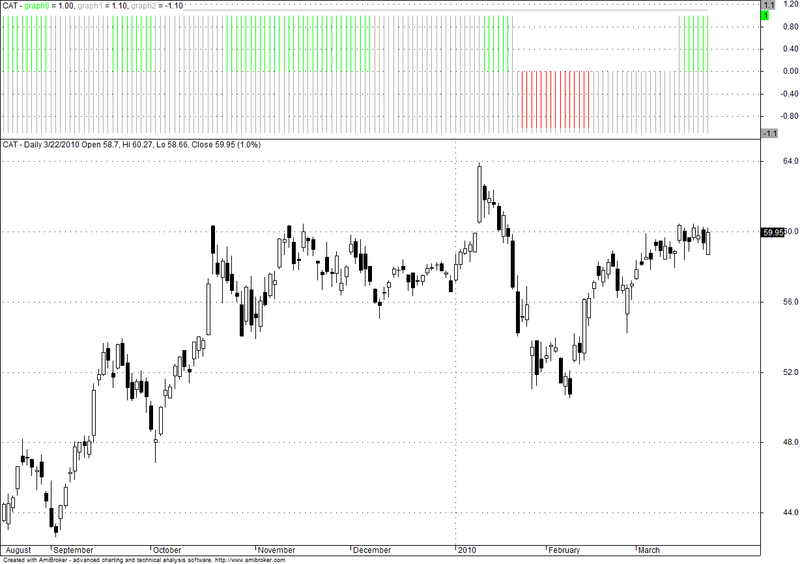
The window displaying green and red vertical bars indicate up and down stock trends respectively. The same window, when neither green or red bars are present, indicate a trading range.This is originally from the scientifictrader.com
Screenshots
Indicator / Formula
Copy & Paste Friendly
_SECTION_BEGIN("TREND");
Aup=40;//40

Adown=60;//60

up=BarsSince(RSI(9)>70);

down=BarsSince(RSI(9)<30);

Graph0=IIf(up<down,1,-1);

Graph0Style=2;

Graph0BarColor=IIf( up<down AND LLV(RSI(9),up)>Aup ,5,IIf(down<up AND HHV(RSI(9),down)<Adown,4,0));

Graph1=1.1;

Graph1Color=0;

Graph2=-1.1;

Graph2Color=0;
_SECTION_END();
2 comments
Leave Comment
Please login here to leave a comment.
This indicator is absolutely horrible at determining trend.
hi, thanks. wonderful one. will it be possible to merge in price chart with buy sell arrow, that will be great.