Range Mix for Amibroker (AFL)
lab1234u over 15 years ago Amibroker (AFL)
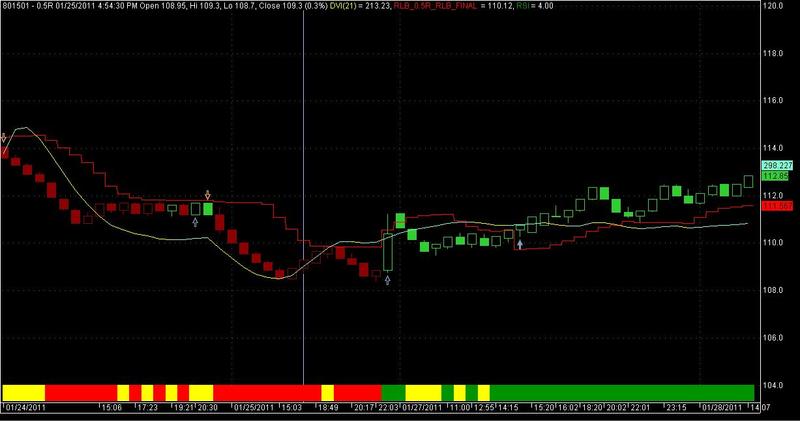
Works well with Range time frame than minutes timeframe in Ami Broker.
Screenshots
Indicator / Formula
Copy & Paste Friendly
_SECTION_BEGIN(" DVI ");
function DailyVolumeIndicator()
{
  midpoint = ( High + Low ) / 2;
  dv = Volume * (( Close - midpoint ) / midpoint);
   return Cum( dv );
}
Period= Param("period",21,1,100,1);
r1=DailyVolumeIndicator();
r2=TEMA( 2*TEMA(r1,int(Period/2))- TEMA(r1,Period),int(sqrt(Period)));
Plot( r2, _DEFAULT_NAME(), IIf( r2> Ref(r2,-1), ParamColor("Up Color",
colorAqua ), ParamColor("Down Color", colorYellow ) ),styleOwnScale);
_SECTION_END();

 _SECTION_BEGIN("RLB_0.5R_RLB_FINAL ");
no= Param("period",3.75,0.25,100,0.05,3);
res= EMA(HHV(H,no),3.75);
sup= EMA(LLV(L,no),3.75);
avd=IIf(EMA(C,3.75)>Ref(res,-1),1,IIf(EMA(C,3.75)<Ref(sup,-1),-1,0));
avn=ValueWhen(avd!=0,avd,1);
supres=   IIf(avn==1,sup,res)    ;
Buy=  ExRem(EMA(H,3.75) > supres,EMA(C,3.75) < supres) ;
Sell= ExRem (EMA(L,3.75)< supres,EMA(C,3.75) > supres) ;
shape = (Buy * shapeUpArrow + Sell * shapeDownArrow);
PlotShapes( shape, IIf( Buy, colorLightBlue, colorLightOrange ),0, IIf( Buy, Low,High ) );
Plot(supres,"RLB_0.5R_RLB_FINAL ",ParamColor( "Color", colorCycle ),styleStaircase,0,0,0);

no=MA(Avg,15);
Buy=Cross(C,no);  Sell=Cross(no,C);
Buy=ExRem(Buy,Sell);  Sell=ExRem(Sell,Buy);
shape = (Buy * shapeHollowUpArrow + Sell * shapeHollowDownArrow);
PlotShapes( shape, IIf( Buy, colorLightBlue, colorLightOrange ),0, IIf( Buy, Low,High ) );

_SECTION_END();
 _SECTION_BEGIN("RLM_Delv");
no4= Param("period",7.5, 0.25, 100, 0.05,3);
res4= TEMA(HHV(H,no4),7.5);
sup4= TEMA(LLV(L,no4),7.5);
avd4=IIf(TEMA(C,7.5)>Ref(res4,-1),1,IIf(TEMA(C,7.5)<Ref(sup4,-1),-1,0));
avn4=ValueWhen(avd4!=0,avd4,1);
supres4= IIf(avn4==1,sup4,res4)    ;

_SECTION_END();
SetChartOptions(0,chartShowArrows|chartShowDates);
_N(Title = StrFormat("{{NAME}} - {{INTERVAL}} {{DATE}} Open %g, Hi %g, Lo %g, Close %g (%.1f%%) {{VALUES}}", O, H, L, C, SelectedValue( ROC( C, 1 ) ) ));
Plot( C,"Close",IIf(TEMA(C,3.75)>supres4 ,colorLime,colorDarkRed), styleNoTitle | ParamStyle("Style") | GetPriceStyle() );
_SECTION_END();

_SECTION_BEGIN("RSI");
periods = Param( "Periods", 14, 1, 200, 1 );
Bull_Trend= RSI( periods)> 50;
Bear_Trend= RSI( periods)< 40;
Ribbon_kol=IIf( Bull_Trend, colorGreen, IIf(Bear_Trend, colorRed,colorYellow)) ;
Plot(4, "RSI", Ribbon_kol, styleOwnScale| styleArea| styleNoLabel,-0.5,100);
_SECTION_END();
_SECTION_END();
3 comments
Leave Comment
Please login here to leave a comment.
THANK YOU BUT HOW TO SWITCH TO Range time frame
Go to Tools→Preferences→Intraday and choose Range from the Tick marked buttons..
Select the range Proportionate to Price
i.e- Suppose Nifty Rate is 5180 then use Range of 13R to 5oR .
U will get Long Signals if u used highest range. 13R is best.
Any scrip of rate of 40/- then use .25 to 1.05R.