Moving Average System for Amibroker (AFL)
tjhailioe over 15 years ago Amibroker (AFL)
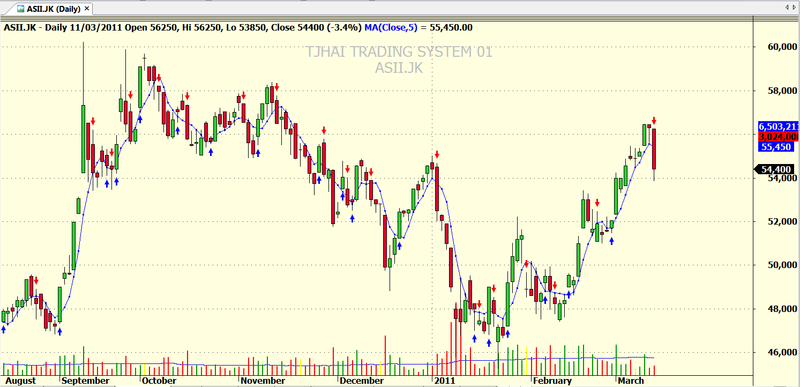
Shows signals if candle above sma 5. Buy if candle above sma 5 and sell if bellow sma 5. this strategy good for short term trader,get out as soon as possible when you already get profit and when you buy don’t forget your stop loss.
I hope it useful for your trading from your friend tjhailioe@gmail.com
Screenshots
Indicator / Formula
Copy & Paste Friendly
_SECTION_BEGIN("scaner if candle above SMA5= buy");

Buy = Cross( C,MA( Close, 5 ) );
Sell = Cross(MA(C,5),C);
PlotShapes(IIf(Buy==1, shapeUpArrow , shapeNone), colorBlue, 0,Low, Offset=-15);
PlotShapes(IIf(Sell==1, shapeDownArrow , shapeNone), colorRed, 0,High, Offset=-15);
_SECTION_END();
_SECTION_BEGIN("Price");
SetChartOptions(0,chartShowArrows|chartShowDates);
_N(Title = StrFormat("{{NAME}} - {{INTERVAL}} {{DATE}} Open %g, Hi %g, Lo %g, Close %g (%.1f%%) {{VALUES}}", O, H, L, C, SelectedValue( ROC( C, 1 ) ) ));
Plot( C, "Close", ParamColor("Color", colorBlack ), styleNoTitle | ParamStyle("Style") | GetPriceStyle() );
_SECTION_END();
GfxSetOverlayMode(1);
GfxSelectFont("Tahoma", Status("pxheight")/40 );
GfxSetTextAlign( 6 );// center alignment
GfxSetTextColor( ParamColor( "Warna", colorLightGrey ) );
GfxSetBkMode(0); // transparent
GfxTextOut( "TJHAI TRADING SYSTEM 01", Status("pxwidth")/2, Status("pxheight")/18 );
_SECTION_BEGIN("MA");
P = ParamField("Price field",-1);
Periods = Param("Periods", 5);
Plot( MA( P, Periods ), _DEFAULT_NAME(), ParamColor( "Color", colorBlue ),styleDots, ParamStyle("Style") );
_SECTION_END();

Plot(V,"",IIf(C>O,colorGreen,IIf(C<O,4,7)),2|4|32768,5);
Plot(MA(V,45),"",colorBlue,0|4|32768,40);
//,styleLine|styleThick|styleOwnScale);

GfxSetOverlayMode(0);
GfxSelectFont("Tahoma", Status("pxheight")/40);
GfxSetTextAlign( 6 );// center alignment
GfxSetTextColor( colorLightGrey );
GfxSetBkMode(0); // transparent
GfxTextOut( Name(), Status("pxwidth")/2, Status("pxheight")/10 );
0 comments
Leave Comment
Please login here to leave a comment.