LABMIX_ for Amibroker (AFL)
lab1234u over 15 years ago Amibroker (AFL)
Hi
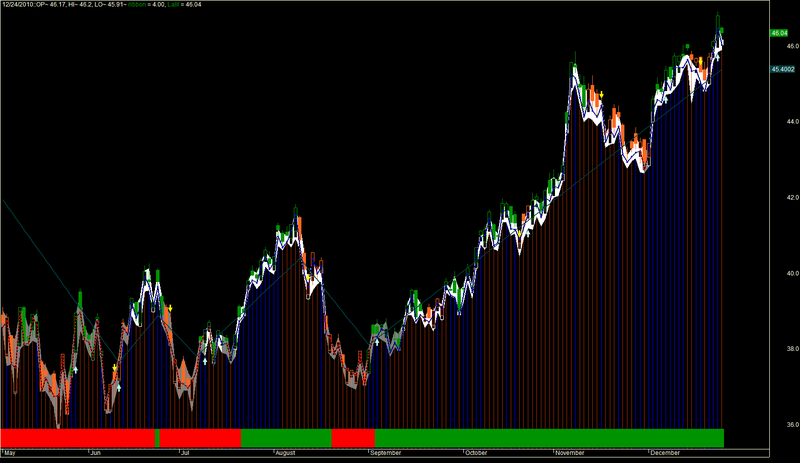
I have mixed Mixed Indicators in it.
Candlestick based on parabolic sar
Cloud candlestick shows raly based on ema close 34
Zig zag for long trend conclusing.
histogram on zig function.
Buy sell Signals based on RMO.
Realy nice———-
N’joy Trading~~~~~~~~~~~
if any suggestions plese contact- lab1234u@gmail.com
and one request- if anybody is using PutCall Ratio Afl code please send me.
Screenshots
Indicator / Formula
Copy & Paste Friendly
P = ParamField( "Price field" );
change = Param("% change",1.4,0.1,13,0.1);
LZ=(Zig(EMA(C,13), Change));
Plot( Zig(LZ, change),"LZS" ,colorDarkOliveGreen, styleLine|styleThick|styleNoTitle);

SwingTrd1 = 100 * (Close - ((MA(C,2)+
MA(MA(C,2),2)+
MA(MA(MA(C,2),2),2) +
MA(MA(MA(MA(C,2),2),2),2) +
MA(MA(MA(MA(MA(C,2),2),2),2),2) +
MA(MA(MA(MA(MA(MA(C,2),2),2),2),2),2) +
MA(MA(MA(MA(MA(MA(MA(C,2),2),2),2),2),2),2)+
MA(MA(MA(MA(MA(MA(MA(MA(C,2),2),2),2),2),2),2),2)+
MA(MA(MA(MA(MA(MA(MA(MA(MA(C,2),2),2),2),2),2),2), 2),2)+
MA(MA(MA(MA(MA(MA(MA(MA(MA(MA(C,2),2),2),2),2),2), 2),2),2),2))/10))/(HHV(C,10)-LLV(C,10));
SwingTrd2=EMA(SwingTrd1,30);
SwingTrd3=EMA(SwingTrd2,30);
RMO= EMA(SwingTrd1,81);
Buy=Cross(SwingTrd2,SwingTrd3);
Sell=Cross(SwingTrd3,SwingTrd2);
Bull_Trend=EMA(SwingTrd1,81)>0;
Bear_Trend=EMA(SwingTrd1,81)<0;
Ribbon_kol=IIf(Bull_Trend,colorGreen, IIf(Bear_Trend,colorRed, colorBlack));
Plot(4, "ribbon", Ribbon_kol, styleOwnScale|styleArea|styleNoLabel, -0.5,100);
Impulse_UP= EMA(SwingTrd1,30) > 0;
Impulse_Down= EMA(SwingTrd1,81) < 0;
bar_kol=IIf(impulse_UP, colorBlue, IIf(impulse_Down, colorRed,IIf(Bull_Trend, colorRed, colorBlue)));
Plot(Close,"Close",bar_kol,styleLine | styleThick|styleDots|styleDashed|styleNoTitle|styleNoLabel );
shape = Buy * shapeUpArrow + Sell * shapeDownArrow;
PlotShapes( shape, IIf( Buy, colorSkyblue, colorYellow ),0, IIf( Buy, Low, High ) );

SetChartOptions(0,chartShowArrows|chartShowDates);
_N(Title = StrFormat("{{DATE}}::OP~ %g, HI~ %g, LO~ %g~ {{VALUES}}", O, H, L, C, SelectedValue( ROC( C, 1 ) ) ));
Plot( C, "Lalit",IIf(C  >SAR(0.04),  colorGreen,colorOrange), styleCandle|styleOwnScale);
Plot( C, "Lalit",IIf(C  >EMA(C,34),  colorWhite,colorGrey50),styleCandle|styleCloud|styleNoTitle|styleNoLabel);
Plot( C, "Lalit",IIf(C  >Zig(C,1.4),  colorBlue,colorBrown),styleBar|styleHistogram|styleNoTitle|styleNoLabel);
0 comments
Leave Comment
Please login here to leave a comment.