Plus Directional Movement Breakout System for Amibroker (AFL)
Alphaboyz over 15 years ago Amibroker (AFL)
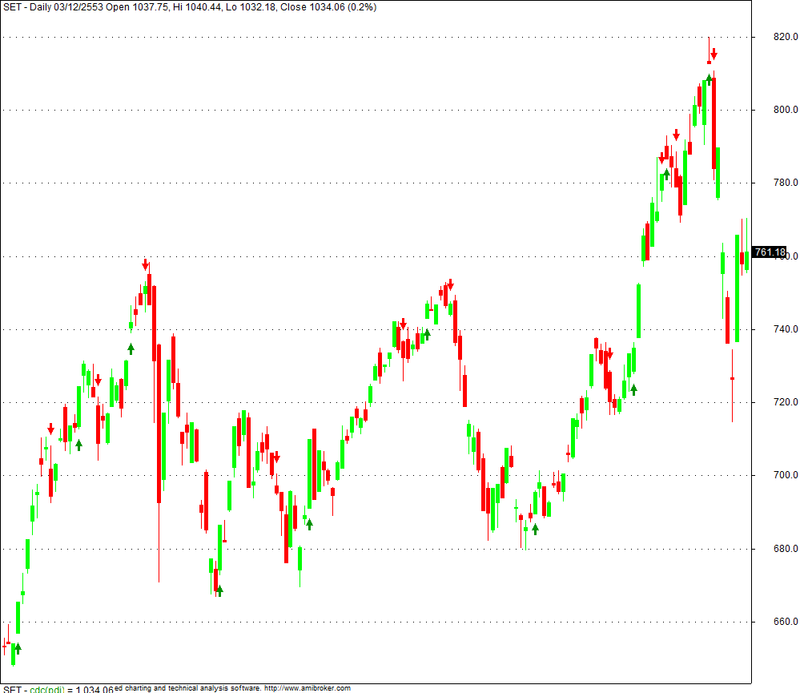
This system is base on Plus Directional Movement (PDI) indicator. Buy and Sell signal were generated from breaking out of new high or new low of historical PDI data. This system is works on both Intraday and EOD. So you can optimize system parameters for your specific market.
Screenshots
Indicator / Formula
Copy & Paste Friendly
_SECTION_BEGIN("Plus Directional Movement Breakout System");

periods = Param("Periods", 14, 2, 200, 1);
pChange = Param("% Change", 5, 0.1, 10, 0.1);

pdiVal = PDI(periods);
pdiPeak = Peak(pdiVal, pChange, 1);
pdiTrough = Trough(pdiVal, pChange, 1);

Buy = Cross(PdiVal, Ref(ValueWhen(pdiPeak != Ref(pdiPeak, -1), pdiVal, 1), -1));
Sell = Cross(Ref(ValueWhen(pdiTrough != Ref(pdiTrough, -1), pdiVal, 1), -1), pdiVal);

Buy = Exrem(Buy, Sell);
Sell = Exrem(Sell, Buy);

_N(Title = StrFormat("{{NAME}} - {{INTERVAL}} {{DATE}} Open %g, Hi %g, Lo %g, Close %g (%.1f%%) {{VALUES}}", O, H, L, C, SelectedValue( ROC( C, 1 ) ) ));
Plot( C, "Close", ParamColor("Price Color", colorBlack ), styleNoTitle | ParamStyle("Price Style") | GetPriceStyle() );
PlotShapes(shapeUpArrow * Buy, colorGreen, 0, L, Offset=-20);
PlotShapes(shapeDownArrow * Sell, colorRed, 0, H, Offset=-20);

_SECTION_END();
2 comments
Leave Comment
Please login here to leave a comment.
thank you
Good Work thanks