Support & Resistance for Amibroker (AFL)
shyam242 about 15 years ago Amibroker (AFL)
Support & Resistance
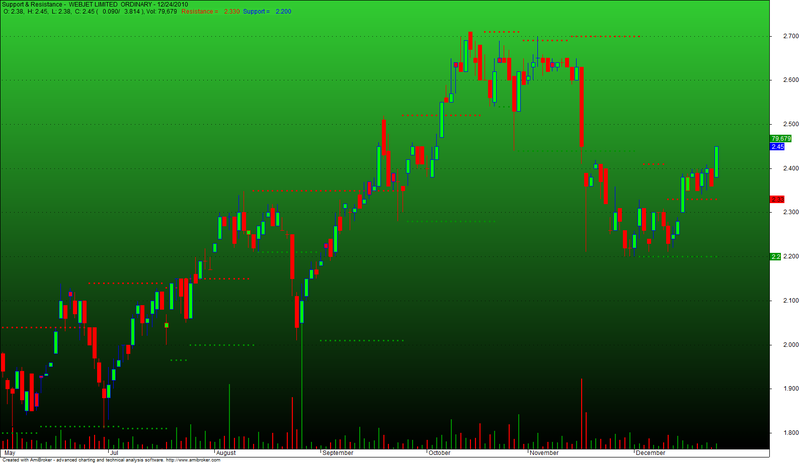
Screenshots
Indicator / Formula
Copy & Paste Friendly
_SECTION_BEGIN("Support & Resistance");
/* SUPPORT AND RESISTANCE */


LB= Param("Look Back Periods",10,1,30,1);
R=ValueWhen(Cross(MA(C,LB),C),HHV(H,LB),1);
S=ValueWhen(Cross(C,MA(C,LB)),LLV(L,LB),1);
//UpClose = Close - Ref(Close,-1);
//Color = IIf(UpClose >= 0, colorBlue, colorRed);

UpClose = Close - Ref(Close,-1);
Color = IIf(UpClose > 0, colorBlue, colorRed);
PlotOHLC(Open,High,Low,Close,"", Color, styleCandle);
Plot (R,"Resz",ParamColor("R Color",colorRed),8+16);
Plot (S,"Supp",ParamColor("S Color",colorGreen),8+16);

//Plot (R,"Resz",22,8+16);
//Plot (S,"Supp",19,8+16);
// Plot (C,"Close",color,64,32);
GraphXSpace=4;
Title = "Support & Resistance -  " + FullName()+ " - " + Date() +
		"\n O: " + O + ",  H: " + H + ",  L: " + L + ",  C: " + C +
		" (" + WriteVal(C-Ref(C,-1)) + "/" + WriteVal((C-Ref(C,-1))*100/ Ref(C,-1)) +" ), Vol: " + WriteVal(round(V),0)
		+ EncodeColor(colorRed) + "   Resistance = " + WriteVal(R) + EncodeColor(colorBlue) + "  Support = " + WriteVal(S);
_SECTION_END();

_SECTION_BEGIN("BackgroundColor");
SetChartBkGradientFill( ParamColor("AboveColour", colorLime),ParamColor("UnderColour", colorBlack));
_SECTION_END();


_SECTION_BEGIN("Volume");
Plot( Volume, _DEFAULT_NAME(), IIf( C >= Ref(C,-1), ParamColor("Up Color", colorGreen ), ParamColor("Down Color", colorRed )),
ParamStyle( "Style", styleHistogram  | styleThick | styleOwnScale, maskHistogram  ),3 ); // height = 5 (can change it)
_SECTION_END();
0 comments
Leave Comment
Please login here to leave a comment.