Intraday Trades for Amibroker (AFL)
vishalsbharati over 14 years ago Amibroker (AFL)
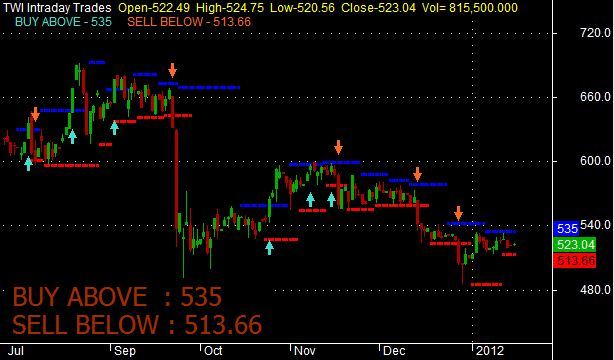
This AFl identifies and plots the supports and resistances.
and signals during breakouts and breakdowns, resistance and support.
please comment…..
Screenshots
Indicator / Formula
Copy & Paste Friendly
Version(5.20);

xx=BarIndex();x=xx;Lx=LastValue(x);

nbar=Param("N Pivot Bars",3,2,50,1);

npiv=Param("N Pivots lookback period",1,1,50,1);

PivotSymmetry=ParamToggle("Use Symmetric Pivots","Off|On",0);

CleanPivots=ParamToggle("Use Clean Pivots","Off|On",0);

srStyle=ParamToggle("S/R Style","Off|On",1);


if (PivotSymmetry)

{

   fc=1;
    pk=H>Ref(HHV(H,nbar*fc),-1) AND Ref(HHV(H,nbar),nbar)<=H;
    pk=pk AND Lx-ValueWhen(pk,x)>nbar*fc;
    tr=L<Ref(LLV(L,nbar*fc),-1) AND Ref(LLV(L,nbar),nbar)>=L;
    tr=tr AND Lx-ValueWhen(tr,x)>nbar*fc;
}
else
{
    fc=2;
    pk=H>Ref(HHV(H,nbar*fc),-1) AND Ref(HHV(H,nbar),nbar)<=H;
    pk=pk AND Lx-ValueWhen(pk,x)>nbar*fc;
    tr=L<Ref(LLV(L,nbar*fc),-1) AND Ref(LLV(L,nbar),nbar)>=L;
    tr=tr AND Lx-ValueWhen(tr,x)>nbar*fc;

}

px0=ValueWhen(pk,x,0); tx0=ValueWhen(tr,x,0);

px1=ValueWhen(pk,x,1); tx1=ValueWhen(tr,x,1);

px2=ValueWhen(pk,x,2); tx2=ValueWhen(tr,x,2);

px3=ValueWhen(pk,x,3); tx3=ValueWhen(tr,x,3);

ph0=ValueWhen(pk,H,0); tl0=ValueWhen(tr,L,0);

ph1=ValueWhen(pk,H,1); tl1=ValueWhen(tr,L,1);

ph2=ValueWhen(pk,H,2); tl2=ValueWhen(tr,L,2);

ph3=ValueWhen(pk,H,3); tl3=ValueWhen(tr,L,3);

if (CleanPivots)

{

   pk=IIf(pk AND px0<tx0 AND ph0>ph1,False,pk);

   tr=IIf(tr AND px0>tx0 AND tl0<tl1,False,tr);

   pk=IIf(pk AND px2>tx1 AND ph1<=ph2,False,pk);

   tr=IIf(tr AND tx2>px1 AND tl1>=tl2,False,tr);

 px0=ValueWhen(pk,x,0); tx0=ValueWhen(tr,x,0);
    px1=ValueWhen(pk,x,1); tx1=ValueWhen(tr,x,1);
    px2=ValueWhen(pk,x,2); tx2=ValueWhen(tr,x,2);
    px3=ValueWhen(pk,x,3); tx3=ValueWhen(tr,x,3);
    ph0=ValueWhen(pk,H,0); tl0=ValueWhen(tr,L,0);
    ph1=ValueWhen(pk,H,1); tl1=ValueWhen(tr,L,1);
    ph2=ValueWhen(pk,H,2); tl2=ValueWhen(tr,L,2);
    ph3=ValueWhen(pk,H,3); tl3=ValueWhen(tr,L,3);
}


GraphXSpace=20;

SetChartOptions(0,chartShowDates);

SetBarFillColor(IIf(C>O,ColorRGB(0,175,0),IIf(C<=O,ColorRGB(175,0,0),colorLightGrey)));

Plot(C,"\nPrice",IIf(C>O,ColorRGB(0,175,0),IIf(C<=O,ColorRGB(175,0,0),colorLightGrey)),64,0,0,0);
//plotting  circles
//PlotShapes(shapeSmallCircle*tr,IIf(Lx-ValueWhen(tr,x)>nbar,ColorRGB(0,100,0),colorWhite),0,L,-10);

//PlotShapes(shapeSmallCircle*pk,IIf(Lx-ValueWhen(pk,x)>nbar,ColorRGB(255,0,0),colorWhite),0,H,10);


if(srstyle)

{

miny=Status("axisminy");

maxy=Status("axismaxy");

for (i=1;i<=npiv;i++)

{

    rr=Ref(ValueWhen(pk,H,i),-nbar);

    rr=IIf(rr>maxy OR rr<miny,Null,rr);

    ss=Ref(ValueWhen(tr,L,i),-nbar);

    ss=IIf(ss>maxy OR ss<miny,Null,ss);

    Plot(rr,"",colorBlue,styleNoLine|styleDots,0,0,0);

    Plot(ss,"",colorRed,styleNoLine|styleDots,0,0,0);
Buy = Cross(H,rr);
Sell= Cross(ss,L);
PlotShapes(IIf(Buy, shapeUpArrow, shapeNone),colorTurquoise, 0,L, Offset=-25);
PlotShapes(IIf(Sell, shapeDownArrow, shapeNone),colorOrange, 0,H, Offset=-25);

}

}

else

{

   rr=ValueWhen(pk,H);

   rr1=IIf(rr AND BarsSince(pk)>nbar,rr,Null);

   rr2=IIf(rr AND BarsSince(pk)<=nbar,rr,Null);

   ss=ValueWhen(tr,L);

   ss1=IIf(ss AND BarsSince(tr)>nbar,ss,Null);

   ss2=IIf(ss AND BarsSince(tr)<=nbar,ss,Null);

   Plot(rr1,"",colorRed,1);

   Plot(rr2,"",colorLightGrey,styleDots|styleNoLine);

   Plot(ss1,"",colorGreen,1);

   Plot(ss2,"",colorLightGrey,styleDots | styleNoLine);

}


Title = EncodeColor(colorWhite)+ "Intraday Trades" + EncodeColor(colorYellow) +"  Open-"+O+"  "+"High-"+H+"  "+"Low-"+L+"  "+
"Close-"+C+"  "+ "Vol= "+ WriteVal(V)+"\n"+EncodeColor(colorTurquoise)+"    BUY ABOVE - "+RR+" "+EncodeColor(colorOrange)+
"    SELL BELOW - "+SS+"	";

_SECTION_END();
GfxSetBkMode( 1 );
GfxSetTextColor( colorBrown );
GfxSelectSolidBrush(colorBlack); // this is the box background color

GfxSelectFont( "Tahoma", 20, 100 );
pxHeight = Status( "pxchartheight" ) ;
 xx = Status( "pxchartwidth");
Left = 1100;
width = 280;
x = 5;
x2 = 270;

y = pxHeight;

//GfxSelectPen( colorGreen, 1); // broader color
GfxRoundRect( x, y - 60, x2, y , 7, 7 ) ;
//GfxTextOut( ( " Trading System "),88,y-165);
GfxTextOut( (" "),27,y-160);
GfxTextOut( ("BUY ABOVE  : "+RR+" "), 13, y-58) ; // The text format location
GfxTextOut( ("SELL BELOW : "+SS+""), 13, y-30);
6 comments
Leave Comment
Please login here to leave a comment.
Thanks for this AFL. LET see how this will help on intraday trade.
GOOD AFL
thanks bro for nice afl and efforts.
hi, can we somehow back test this afl…..
rlamba66@gmail.com
gives an error on amibroker 5.1 ss not initialised – can someone help
Fine one…. But Pls correct this afl……..
How is possible if trades in between the given buy and sell values..