TD DeMarker Plane for Amibroker (AFL)
extremist about 15 years ago Amibroker (AFL)
here i used the codes by others but wht i have done is adopted for proper combination of indicators.
1. Demarker
2. JMA
3. ALMA
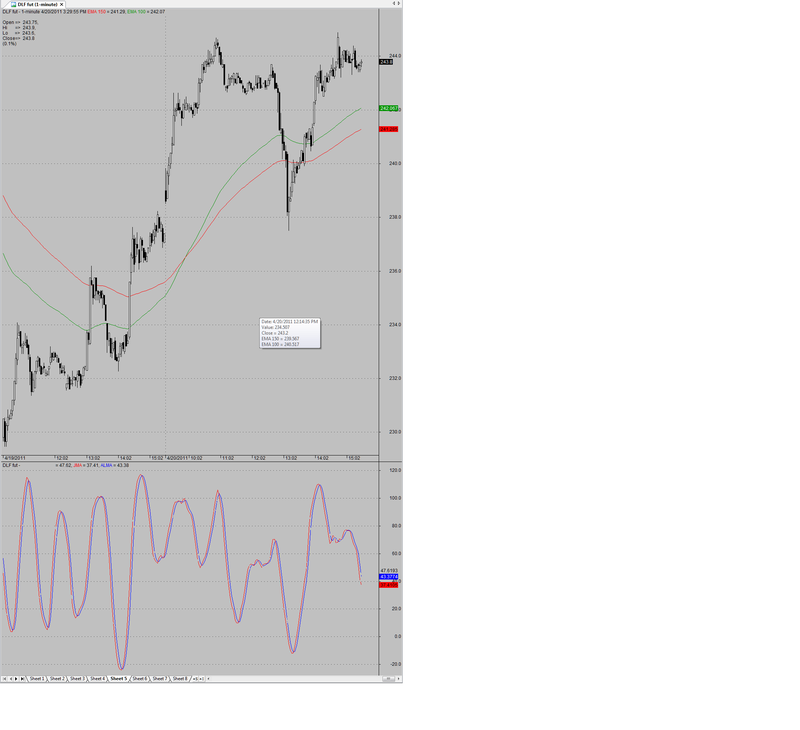
Actually in indicator panel u could see 2 waves one is JMA of Demarker and the other is signal line i.e. ALMA of JMA.
Buy on JMA ,ALMA crossover.
sell on ALMA ,JMA crossover.
the beauty of this indicator is use it in any time frame; it will make sure tht u will almost always end up in profits.
Credits to those original coders….
Screenshots
Indicator / Formula
Copy & Paste Friendly
_SECTION_BEGIN("TD DeMarker Plane");
t=Param("time",13,1,200,1);

highm = IIf( H > Ref( H, -1 ), H - Ref( H, - 1), 0 );
lowm = IIf( L < Ref( L, -1 ), Ref( L, - 1 ) - L, 0 );

DeMarker = 100 *  Sum( highm, t )/( Sum( lowm, t ) + Sum( highm, t ) );

Plot(DeMarker,"DeMarker plane",ParamColor("color",Colorcycle),ParamStyle("style",styleLine));


function JMA( array, per )
{
TN1=MA(array,per);
s1=0;
for( i = 0; i < per; i=i+1 )
{
s1=s1+((per-(2*i)-1)/2)*Ref(array,-i);
}
return TN1+(((per/2)+1)*S1)/((per+1)*per);
}
k=Param("Period",15,1,100,1);
p = ParamField("Price Field");

J=JMA(C,k);
Plot( JMA(p,k), "JMA",ParamColor("color",Colorcycle),ParamStyle("style",styleLine) );


function ALMA(priceField, windowSize, sigma, Offset)
{
	m = floor(Offset * (windowSize - 1));
	s = windowSize / sigma;

	w = 0;
	wSum = 0;

	for(i = 1; i < windowSize; i++)
	{
		w[i] = exp(-((i-m)*(i-m))/(s*s));
		wSum += w[i];
	}

	for(i = 1; i < windowSize; i++)
	{
		w[i] = w[i] / wSum;
	}

	outalma = Null;

	for(j = 0; j < BarCount; j++)
	{
		alSum = 0;

		if(j < windowSize)
		{
			outalma[j] = Null;
		}
		else
		{
			for(i = 1; i < windowSize; i++)
			{
				alSum += priceField[j - (windowSize - 1 - i)] * w[i];
			}

			outalma[j] = alSum;
		}
	}

	return outalma;
}

p = ParamField("Price Field");
windowSize = Param("Window Size", 7, 5, 201, 2);
sigma = Param("Sigma", 6, 1, 20);
Offset = Param("Offset", 0.85, 0.05, 1.0, 0.05);

Plot(ALMA(p, windowSize, sigma, Offset), "ALMA", ParamColor("Color",colorBlue), ParamStyle("Style"));
0 comments
Leave Comment
Please login here to leave a comment.