Stock Portfolio Organizer
The ultimate porfolio management solution.
Shares, Margin, CFD's, Futures and Forex
            EOD and Realtime
            Dividends and Trust Distributions
            And Much More ....
          WiseTrader Toolbox
#1 Selling Amibroker Plugin featuring:
Advanced Adaptive Indicators
            Advanced Pattern Exploration
            Neural Networks
            And Much More ....
          DISTANCE FROM BASE for Amibroker (AFL)
Rating:
      
  5 / 5 (Votes 1)
Tags:
      oscillator, amibroker
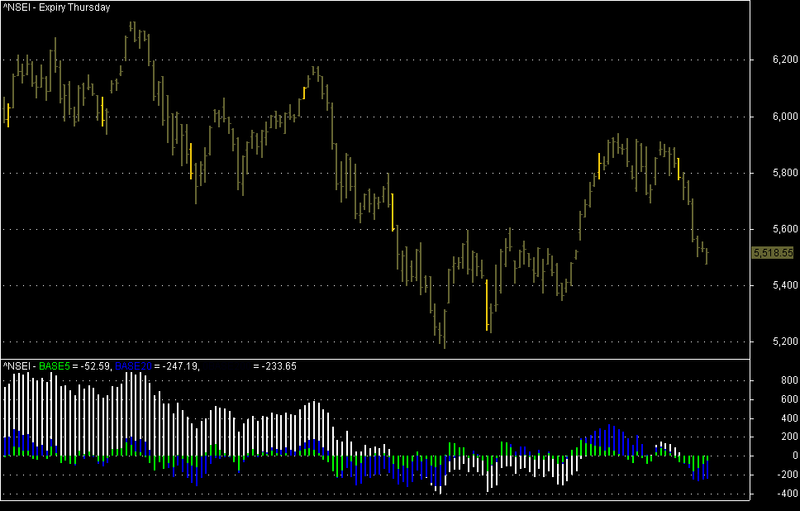
    HELPS TO FIND HOW FAR PRICE HAS MOVED FROM THE BASE…
Screenshots
Similar Indicators / Formulas
                    Febo RSI ..real indicator
                    
                
                      Submitted
                      by abhinavsingh almost 14 years ago
                    
                  
                    Trading Volume Statistic
                    
                
                      Submitted
                      by tuanstock1 over 11 years ago
                    
                  
                    Ergodic Oscillator
                    
                
                      Submitted
                      by dljtrader almost 15 years ago
                    
                  
                    3 Days Track
                    
                
                      Submitted
                      by janet0211 over 15 years ago
                    
                  
                    Chande Momentum Oscillator
                    
                
                      Submitted
                      by klimpek almost 15 years ago
                    
                  
                    BoH Risk Aversion Indicator
                    
                
                      Submitted
                      by genkumag almost 14 years ago
                    
                  Indicator / Formula
Copy & Paste Friendly
_SECTION_BEGIN("DISTANCE FROM BASE");
PERIOD1=5;
PERIOD2=20;
PERIOD3=50;
PERIOD4=100;
PERIOD5=200;
PERIOD6=280;
C=Close;
z5=( Close - MA( Close, period1 ));
z20=( Close - MA( Close, period2 ));
z50=( Close - MA( Close, period3 ));
z100=( Close - MA( Close, period4 ));
z200=( Close - MA( Close, period5 ));
z280=( Close - MA( Close, period6 ));
////////////////////////////////////////////////////////////
zST=StDev( Close, period2 );
z3=z20/zST;
//////////////////////////////////////////////////
Plot( Z5, "BASE5", ColorRGB(0,255,0),ParamStyle("Style",styleHistogram |styleThick|styleNoLabel ,maskAll) );
Plot( Z20, "BASE20", ColorRGB(0,0,255),ParamStyle("Style",styleHistogram |styleThick|styleNoLabel ,maskAll) );
//Plot( Z50, "BASE50", ColorRGB(255,100,0),ParamStyle("Style",styleHistogram |styleThick|styleNoLabel ,maskAll) );
//Plot( Z100, "BASE100", ColorRGB(255,0,0),ParamStyle("Style",styleHistogram |styleThick|styleNoLabel ,maskAll) );
Plot( Z200, "BASE200", ColorRGB(255,255,255),ParamStyle("Style",styleHistogram |styleThick|styleNoLabel ,maskAll) );
//Plot( Z280, "BASE280", ColorRGB(240,0,0),ParamStyle("Style",styleHistogram |styleThick|styleNoLabel ,maskAll) );
_SECTION_END();0 comments
Leave Comment
Please login here to leave a comment.
Back