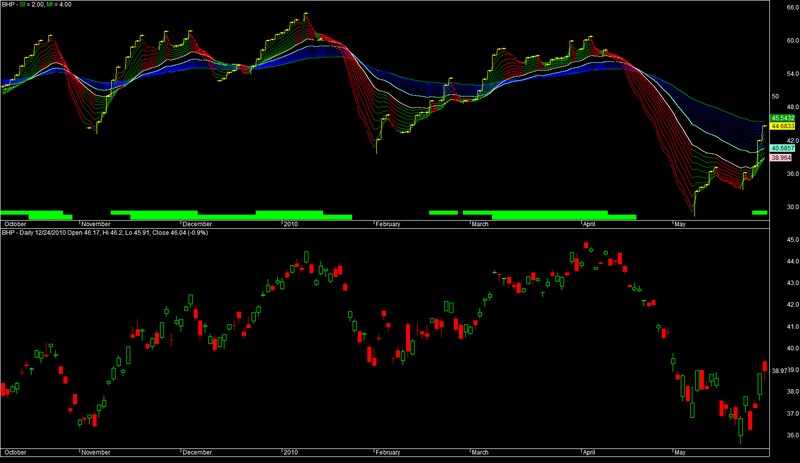
Guppy Rsi for Amibroker (AFL)
thakkarps about 15 years ago Amibroker (AFL)
This is for short to medium Trend Trading
Screenshots
Indicator / Formula
Copy & Paste Friendly
a = Param("rsi", 21, 2, 90, 1, 10 );
b1 = Param("period1", 3, 2, 300, 1, 10 );
b2 = Param("period2", 33, 2, 300, 1, 10 );


COLORRSI= IIf (EMA( RSI(a), 3 )>Ref(EMA( RSI(a), 3 ),-1), colorGreen,colorRed);
COLORRSI1= IIf (EMA( RSI(a), 33 )>Ref(EMA( RSI(a), 33 ),-1), colorBlue,colorDarkBlue);

aa=EMA(RSI(a),3);
Col=IIf(aa>Ref(aa,-1),colorYellow,colorBlack);
//Plot( RSI( 21), "", colorWhite, styleThick  );
Plot( EMA( RSI(a), 3 ),  "",col, styleStaircase|styleDots, styleNoLabel );
Plot( EMA( RSI(a), 4 ),  "",colorRSI, styleNoLabel);
Plot( EMA( RSI(a), 5 ),  "",colorRSI, styleNoLabel);
Plot( EMA( RSI(a), 7 ),  "",colorRSI, styleNoLabel);
Plot( EMA( RSI(a), 9 ),  "",colorRSI, styleNoLabel);
Plot( EMA( RSI(a), 11 ),  "",colorRSI, styleNoLabel);
Plot( EMA( RSI(a), 13 ),  "",colorRSI, styleNoLabel);
Plot( EMA( RSI(a), 15 ),  "",colorRSI, styleNoLabel);
Plot( EMA( RSI(a), 17 ),  "",colorRSI, styleNoLabel);
Plot( EMA( RSI(a), 19 ),  "",colorRSI, styleNoLabel);
Plot( EMA( RSI(a), 21 ),  "",colorPink, styleThick, styleNoLabel);

Plot( EMA( RSI(a), 33 ),  "",colorAqua, styleThick, styleNoLabel );
Plot( EMA( RSI(a), 36 ), "", COLORRSI1,  styleNoLabel );
Plot( EMA( RSI(a), 40 ),  "",COLORRSI1,  styleNoLabel );
Plot( EMA( RSI(a), 44 ),  "",COLORRSI1,  styleNoLabel );
Plot( EMA( RSI(a), 50 ),  "",COLORRSI1,  styleNoLabel );
Plot( EMA( RSI(a), 55 ),  "",COLORRSI1,  styleNoLabel);
Plot( EMA( RSI(a), 60 ),  "",COLORRSI1,  styleNoLabel);
Plot( EMA( RSI(a), 65 ),  "",COLORRSI1,  styleNoLabel );
Plot( EMA( RSI(a), 70 ),  "",COLORRSI1,  styleNoLabel);
Plot( EMA( RSI(a), 75 ),  "",colorGreen, styleThick , styleNoLabel);

Plot(50,"",colorBlack,styleLine);
z1=EMA(RSI(a),21);
z2=EMA(RSI(a),33);
up1=z1>z2;
dn1=z1<z2;
up2=aa>z1;
dn2=aa<z1;

Plot( 2, "St",IIf(up1,colorBrightGreen,IIf(dn1,colorBlack,colorLightGrey)),styleOwnScale|styleArea|styleNoLabel,-0.5,100);
Plot( 4, "Mt",IIf(up2,colorBrightGreen,IIf(dn2,colorBlack,colorLightGrey)),styleOwnScale|styleArea|styleNoLabel,-0.5,100);
4 comments
Leave Comment
Please login here to leave a comment.
Hi… Thanks for sharing. It´s seems to be a good indicator.
I was just trying to include the buy / sell parameters but i din´t get it. Could you help me?
thks.
This is really cool
//Add in for back test.
Buy= up1 AND up2;
Sell = dn1 OR dn2;
Buy = ExRem( Buy, Sell );
Sell = ExRem( Sell, Buy );
Short = dn1 AND dn2;
Cover = up1 OR up2;
Short = ExRem( Short, Cover);
Cover = ExRem( Cover,Short);
What is a good PositionScore to use when backtesting with a collection of stocks?