Advanced Trend Lines for Amibroker (AFL)
Arun about 15 years ago Amibroker (AFL)
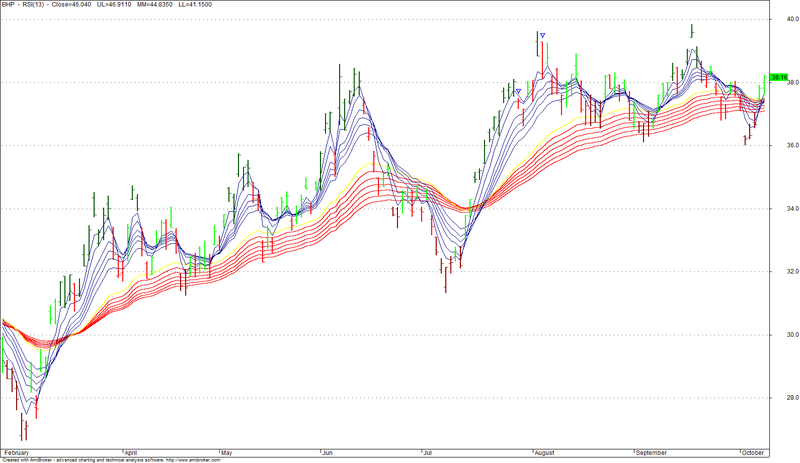
IT works Better in Intraday and Daily…
Screenshots
Indicator / Formula
Copy & Paste Friendly
_SECTION_BEGIN("Advanced Trend Lines");
function TD_Supply()
{
   return ( H > Ref(H, 1) AND H > Ref(H, -1) AND H > Ref(C, -2));
}
function TD_Demand()
{
   return ( L < Ref(L, 1) AND L < Ref(L, -1) AND L < Ref(C, -2));
}

function IsTD_Supply(n)
{
   n = (BarCount - 1) - n;
   return LastValue( Ref(H, -n) > Ref(H, -n+1) AND Ref(H, -n) > Ref(H, -n-1) AND Ref(H, -n) > Ref(C, -n-2));
}
function IsTD_Demand(n)
{
   n = (BarCount - 1) - n;
   return LastValue( Ref(L, -n) < Ref(L, -n+1) AND Ref(L, -n) < Ref(L, -n-1) AND Ref(L, -n) < Ref(C, -n-2));
}
function GetXSupport(Lo, Percentage, Back)
{
 return ((BarCount - 1) - LastValue(TroughBars(Lo, Percentage,Back)));
}
function GetYSupport(Lo, Percentage, Back)
{
 return (LastValue(Trough(Lo, Percentage, back)));
}

function GetXResistance(Hi, Percentage, Back)
{
 return ((BarCount - 1) -LastValue(PeakBars(Hi, Percentage, Back)));
}
function GetYResistance(Hi, Percentage, Back)
{
 return (LastValue(Peak(Hi, Percentage, Back)));
}
////////////////////////////////////////////////////////////////////////
//Parameters
Percentage    = Param("Percentage", 0.02, 0.01, 100. ,0.01);
Lines          = Param("Lines?", 1, 1, BarCount-2);
DrawR          = ParamList("Resistance Points", "Off|High to High|High to Low", 1);
DrawS          = ParamList("Support Points", "Off|Low to Low|Low to High", 1);
DrawAllLines    = ParamToggle("Draw All Lines?", "Yes|No", 1);
Method       = ParamToggle("Method", "TD Points|ZigZag",0);
ShowTDP       = ParamToggle("Show TD Pionts", "Yes|No",0);
AllOrDownR    = ParamToggle("Resistance Direction", "All|Down");
AllOrUpS       = ParamToggle("Support Direction", "All|Up");
////////////////////////////////////////////////////////////////////////
Main = C;
Con = ConS = ConR = 1;
if(DrawS=="Low to Low")
{
   Support1 = L;
   Support2 = L;
}
else
{
   Support1 = L;
   Support2 = H;
}
if(DrawR=="High to High")
{
   Resistance1 = H;
   Resistance2 = H;
}
else
{
   Resistance1 = H;
   Resistance2 = L;
}
////////////////////////////////////////////////////////////////////////
//Plotting Area
Col_cci = IIf(CCI(20) > 100, colorDarkGreen,IIf(CCI(20) <-100,colorDarkRed,IIf(CCI(20) > Ref(CCI(20),-1),colorBrightGreen,colorRed)));
Plot(Main, "",Col_cci , styleBar+styleThick);
if(DrawAllLines)
for(i = 2; i<=Lines+1; i++)
{
   if(DrawS!="Off")
   {
      x0 = GetXSupport(Support1, Percentage, i);
      x1 = GetXSupport(Support2, Percentage, i-1);
      y0 = GetYSupport(Support1, Percentage, i);
      y1 = GetYSupport(Support2, Percentage, i-1);
      x = LineArray(x0, y0, x1, y1, 1);
      if(!Method)
         Con = (IsTD_Demand(x0) AND IsTD_Demand(x1));
      if(AllOrUpS) ConS = y0 < y1;
      if(Con AND ConS)
         Plot(x, "", colorAqua, styleLine|styleThick);
   }
   if(DrawR!="Off")
   {
      x0 = GetXResistance(Resistance1, Percentage, i);
      x1 = GetXResistance(Resistance2, Percentage, i-1);
      y0 = GetYResistance(Resistance1, Percentage, i);
      y1 = GetYResistance(Resistance2, Percentage, i-1);
      x = LineArray(x0, y0, x1, y1, 1);
      if(!Method)
         Con = (IsTD_Supply(x0) AND IsTD_Supply(x1));
      if(AllOrDownR) ConR = y0 > y1;
      if(Con AND ConR)
         Plot(x, "", colorOrange , styleLine|styleThick);
   }
}
else
{
   if(DrawS!="Off")
   {
      x0 = GetXSupport(Support1, Percentage, Lines+1);
      x1 = GetXSupport(Support2, Percentage, Lines);
      y0 = GetYSupport(Support1, Percentage, Lines+1);
      y1 = GetYSupport(Support2, Percentage, Lines);
      x = LineArray(x0, y0, x1, y1, 1);
      if(!Method)
         Con = (IsTD_Demand(x0) AND IsTD_Demand(x1));
      if(AllOrUpS) ConS = y0 < y1;
      if(Con AND ConS)
         Plot(x, "", colorLightBlue, styleLine|styleThick);
   }
   if(DrawR!="Off")
   {
      x0 = GetXResistance(Resistance1, Percentage, Lines+1);
      x1 = GetXResistance(Resistance2, Percentage, Lines);
      y0 = GetYResistance(Resistance1, Percentage, Lines+1);
      y1 = GetYResistance(Resistance2, Percentage, Lines);
      x = LineArray(x0, y0, x1, y1, 1);
      if(!Method)
         Con = (IsTD_Supply(x0) AND IsTD_Supply(x1));
      if(AllOrDownR) ConR = y0 > y1;
      if(Con AND ConR)
         Plot(x, "", colorRed , styleLine|styleThick);
   }
}

if(ShowTDP)
{
   PlotShapes(TD_Supply()*shapeSmallCircle, colorRed, 0, H, H*.001);
   PlotShapes(TD_Demand()*shapeSmallCircle, colorGreen, 0, L, -L*.001);
}
//Title =FullName()+" ({{NAME}})\n{{DATE}}\n"+"Open: "+O+", Hi: "+H+", Lo: "+L+", Close: "+C;

_SECTION_END();

_SECTION_BEGIN("Price");
Col_1 = IIf(EMA(RSI(39),30) > Ref(EMA(RSI(39),30),-1),colorGreen,colorOrange);
//Plot( C, "Close", col_1, styleCandle+styleThick );
_SECTION_END();

_SECTION_BEGIN("guppy");
e3 = EMA(Close,3);
e5 = EMA(Close,5);
e8 = EMA(Close,8);
e10 = EMA(Close,10);
e12 = EMA(Close,12);
e15 = EMA(Close,15);

e30 = EMA(Close,30);
e35 = EMA(Close,35);
e40 = EMA(Close,40);
e45 = EMA(Close,45);
e50 = EMA(Close,50);
e55 = EMA(Close,55);
e60 = EMA(Close,60);
Buy_guppy = e3>e45;
Sell_guppy = e45 > e3;
//Buy_guppy = ExRem (Buy_guppy,Sell_guppy);
//Sell_guppy = ExRem(Sell_guppy,Buy_guppy);
//PlotShapes(Buy_guppy*shapeUpTriangle, colorYellow);
//PlotShapes(Sell_guppy*shapeDownTriangle,colorYellow);

Plot (e3,"",colorDarkBlue,styleNoLabel);
Plot (e5,"",colorDarkBlue,styleNoLabel);
Plot (e8,"",colorDarkBlue,styleNoLabel);
Plot (e10,"",colorDarkBlue,styleNoLabel);
Plot (e12,"",colorDarkBlue,styleNoLabel);
Plot (e15,"",colorDarkBlue,styleNoLabel);

Plot (e30,"",colorYellow,styleNoLabel+styleThick);
Plot (e35,"",colorRed,styleNoLabel+styleThick);
Plot (e40,"",colorRed,styleNoLabel+styleThick);
Plot (e45,"",colorRed,styleNoLabel+styleThick);
Plot (e50,"",colorRed,styleNoLabel+styleThick);
Plot (e55,"",colorRed,styleNoLabel+styleThick);
Plot (e60,"",colorRed,styleNoLabel+styleThick);

_SECTION_END();


_SECTION_BEGIN("Indicator price rsi  levels");
// RSI Levels - appplied to Price Chart shows how far
// tomorrow's closing price has to move in order for
// the RSI to cross the 70, 50 & 30 levels.

pd = Param("Periods",13,5,144,1);
pds = 2*pd-1;//     (Adjustment for Wilders MA)
aa = Close-Ref(Close,-1);
uu = EMA(Max(0,aa),pds);
dd=  EMA((Max(0,0-aa)),pds);

rf = IIf(C>2,1000,10000);

c1 = Param("Upper Level",70,50,90,1);
qq1 =100/(100-c1)-1;
ff1 = qq1*dd-uu;
ff2 = ff1/qq1;
f1 = Max(ff1,ff2);
UL = Close + f1*(pds-1)/2;
UL = IIf(UL>C,floor(UL*rf),ceil(UL*rf))/rf;

c2 = Param("Equilibrium",50,50,50,0);
qq2 =100/(100-c2)-1;// [=1]
ff = dd-uu;
MM = Close + ff*(pds-1)/2;
MM = IIf(MM>C,floor(MM*rf),ceil(MM*rf))/rf;

c3 = Param("Lower Level",30,10,50,1);
qq3 =100/(100-c3)-1;
ff1 = qq3*dd-uu;
ff2 = ff1/qq3;
f3 = Min(ff1,ff2);
LL = Close + f3*(pds-1)/2;
LL = IIf(LL>C,floor(LL*rf),ceil(LL*rf))/rf;

band = Param("band width",4,0,15,0.25);
mmu = MM+band;
mmd = MM-band;


X=Cross( C,LL);
Y=Cross(UL,C);

Buy1= X ;
Sell1= Y ;

PlotShapes(shapeHollowSmallUpTriangle*Buy1,colorBlue,0,L,-15);
PlotShapes(shapeHollowSmallDownTriangle*Sell1,colorBlue,0,H,-15);

Filter=Buy1 OR Sell1 ;
AddTextColumn(FullName(),"Name");
AddColumn(Buy1,"Buy");
AddColumn(Sell1,"sell");


Title = Name() + "  -  RSI(" + WriteVal(pd,0.0) + ")  -  Close=" +  WriteVal(Close,0.3) + "    UL=" +  WriteVal(UL,0.4) + "    MM=" +  WriteVal(MM,0.4) + "    LL=" +  WriteVal(LL,0.4);
_SECTION_END();

_SECTION_END();
1 comments
Leave Comment
Please login here to leave a comment.
Dear,
How have you been?Would you please tell how to interpret this AFL?
Regards,
Sunny
email:ahalimchy@yahoo.com