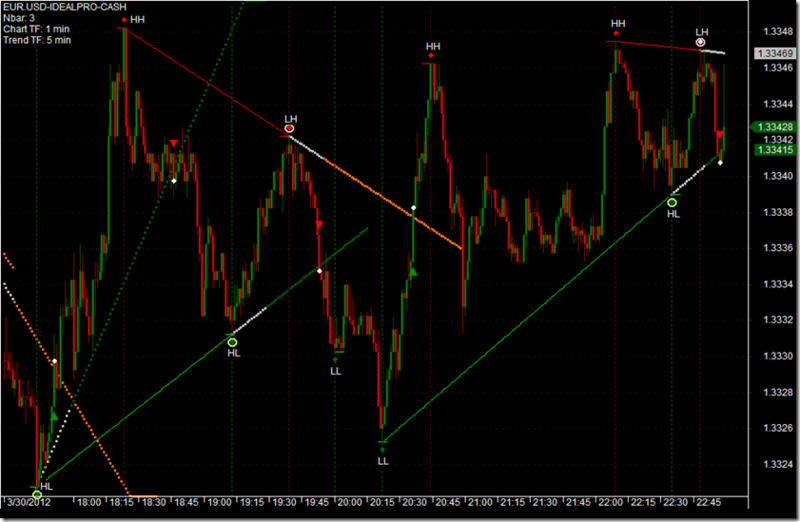
Trendline Multiple TimeFrame for Amibroker (AFL)
vargasc1 over 14 years ago Amibroker (AFL)
Amibroker AFL code by Edward Pottasch, 6/8/2011
Using fractals to create automatic trendlines
Using option to show multiple timeframes
Version(5.21);
This indicator is published with the generous permission
of the author Edward Pottasch. Thanks Ed.
Screenshots
Indicator / Formula
Copy & Paste Friendly
_SECTION_BEGIN("Trendlines Multitimeframe");
// Amibroker AFL code by Edward Pottasch, 6/8/2011
// Using fractals to create automatic trendlines
// Using option to show multiple timeframes
Version(5.21);
xx=BarIndex();x=xx;Lx=LastValue(x);
nbar=Param("N Pivot Bars",3,2,50,1);
tf=Param("Time Frame (min)",5,1,100000,1);tfrm=in1Minute*tf;
CleanPivots=ParamToggle("Use Clean Pivots","Off|On",0);
PivotSymmetry=ParamToggle("Use Symmetric Pivots","Off|On",0);
tld=ParamToggle("All trendlines","Show|Hide",1);
showSignals=ParamToggle("Display signals","Off|On",0);

TimeFrameSet(tfrm);
if (PivotSymmetry)
{
	fc=1;
	pk=H>Ref(HHV(H,nbar*fc),-1) AND Ref(HHV(H,nbar),nbar)<=H;
	tr=L<Ref(LLV(L,nbar*fc),-1) AND Ref(LLV(L,nbar),nbar)>=L;
}
else
{
	fc=2;
	pk=H>Ref(HHV(H,nbar*fc),-1) AND Ref(HHV(H,nbar),nbar)<=H;
	tr=L<Ref(LLV(L,nbar*fc),-1) AND Ref(LLV(L,nbar),nbar)>=L;
}
px0=ValueWhen(pk,x,0); tx0=ValueWhen(tr,x,0);
px1=ValueWhen(pk,x,1); tx1=ValueWhen(tr,x,1);
px2=ValueWhen(pk,x,2); tx2=ValueWhen(tr,x,2);
ph0=ValueWhen(pk,H,0); tl0=ValueWhen(tr,L,0);
ph1=ValueWhen(pk,H,1); tl1=ValueWhen(tr,L,1);
ph2=ValueWhen(pk,H,2); tl2=ValueWhen(tr,L,2);
if (CleanPivots)
{
tr=IIf(pk AND tr AND ph1>ph2 AND tl1>tl2,False,tr);
pk=IIf(pk AND tr AND ph1<ph2 AND tl1<tl2,False,pk);

px0=ValueWhen(pk,x,0); tx0=ValueWhen(tr,x,0);
px1=ValueWhen(pk,x,1); tx1=ValueWhen(tr,x,1);
px2=ValueWhen(pk,x,2); tx2=ValueWhen(tr,x,2);
ph0=ValueWhen(pk,H,0); tl0=ValueWhen(tr,L,0);
ph1=ValueWhen(pk,H,1); tl1=ValueWhen(tr,L,1);
ph2=ValueWhen(pk,H,2); tl2=ValueWhen(tr,L,2);

pk=IIf(pk AND px1>tx1 AND ph1<tl1,False,pk);
tr=IIf(tr AND tx1>px1 AND tl1>ph1,False,tr);
pk=IIf(pk AND px0<tx0 AND ph0>ph1,False,pk);
tr=IIf(tr AND px0>tx0 AND tl0<tl1,False,tr);
pk=IIf(pk AND px2>tx1 AND ph1<=ph2,False,pk);
tr=IIf(tr AND tx2>px1 AND tl1>=tl2,False,tr);
pk=IIf(pk AND px0>px1 AND px1>tx1 AND px1>tx0 AND ph0>ph1,False,pk);
tr=IIf(tr AND tx0>tx1 AND tx1>px1 AND tx1>px0 AND tl0<tl1,False,tr);

px0=ValueWhen(pk,x,0); tx0=ValueWhen(tr,x,0);
px1=ValueWhen(pk,x,1); tx1=ValueWhen(tr,x,1);
px2=ValueWhen(pk,x,2); tx2=ValueWhen(tr,x,2);
ph0=ValueWhen(pk,H,0); tl0=ValueWhen(tr,L,0);
ph1=ValueWhen(pk,H,1); tl1=ValueWhen(tr,L,1);
ph2=ValueWhen(pk,H,2); tl2=ValueWhen(tr,L,2);

pk=IIf(pk AND px1>tx1 AND px2>tx1 AND ph1<ph2,False,pk);
tr=IIf(tr AND tx1>px1 AND tx2>px1 AND tl1>tl2,False,tr);
}
pkh=IIf(pk,H,Null);
trl=IIf(tr,L,Null);
TimeFrameRestore();
fact=Max(tfrm/60,Interval()/60)/(Interval()/60);
Lkbk=tfrm/Interval();
if(Lkbk>1)
{
	pk=TimeFrameExpand(pk,tfrm,expandFirst);
	pkh=TimeFrameExpand(pkh,tfrm,expandFirst);
	pkhs=IIf(!IsEmpty(pkh),1,0);pkhs=pkhs-Ref(pkhs,-1);
	pk=pk AND H==pkh;
	cond1=Sum(pk,BarsSince(pkhs==1)+1)==1 AND pk;
	pk=pk AND cond1;

	tr=TimeFrameExpand(tr,tfrm,expandFirst);
	trl=TimeFrameExpand(trl,tfrm,expandFirst);
	trls=IIf(!IsEmpty(trl),1,0);trls=trls-Ref(trls,-1);
	tr=tr AND L==trl;
	cond1=Sum(tr,BarsSince(trls==1)+1)==1 AND tr;
	tr=tr AND cond1;

	px0=ValueWhen(pk,x,0); tx0=ValueWhen(tr,x,0);
	px1=ValueWhen(pk,x,1); tx1=ValueWhen(tr,x,1);
	px2=ValueWhen(pk,x,2); tx2=ValueWhen(tr,x,2);
	ph0=ValueWhen(pk,H,0); tl0=ValueWhen(tr,L,0);
	ph1=ValueWhen(pk,H,1); tl1=ValueWhen(tr,L,1);
	ph2=ValueWhen(pk,H,2); tl2=ValueWhen(tr,L,2);
}
y0=ValueWhen(tr,trl,0);
y1=ValueWhen(tr,trl,1);
y2=ValueWhen(tr,trl,2);
y3=ValueWhen(tr,trl,3);
x0=ValueWhen(tr,xx,0);
x1=ValueWhen(tr,xx,1);
x2=ValueWhen(tr,xx,2);
x3=ValueWhen(tr,xx,3);
aa=(Y0-Y1)/(X0-X1);
ls1=aa*(xx-X1)+Y1;
dls1=ls1-Ref(ls1,-1);
aa=(Y1-Y2)/(X1-X2);
ls2=aa*(xx-X1)+Y1;
dls2=ls2-Ref(ls2,-1);
dls2=IIf(tr,Ref(dls1,-1),dls2);
aa=(Y2-Y3)/(X2-X3);
ls3=aa*(xx-X2)+Y2;
dls3=ls3-Ref(ls3,-1);
dls3=IIf(tr,Ref(dls2,-1),dls3);
y0=ValueWhen(pk,pkh,0);
y1=ValueWhen(pk,pkh,1);
y2=ValueWhen(pk,pkh,2);
y3=ValueWhen(pk,pkh,3);
x0=ValueWhen(pk,xx,0);
x1=ValueWhen(pk,xx,1);
x2=ValueWhen(pk,xx,2);
x3=ValueWhen(pk,xx,3);
aa=(Y0-Y1)/(X0-X1);
hs1=aa*(xx-X1)+Y1;
dhs1=hs1-Ref(hs1,-1);
aa=(Y1-Y2)/(X1-X2);
hs2=aa*(xx-X1)+Y1;
dhs2=hs2-Ref(hs2,-1);
dhs2=IIf(pk,Ref(dhs1,-1),dhs2);
aa=(Y2-Y3)/(X2-X3);
hs3=aa*(xx-X2)+Y2;
dhs3=hs3-Ref(hs3,-1);
dhs3=IIf(pk,Ref(dhs2,-1),dhs3);
if (tld)
{
	dd=0.0;
	Vh=dd*(ValueWhen(pk,C)-ValueWhen(pk,Ref(C,-1)))/ValueWhen(pk,C);
	Vl=dd*(ValueWhen(tr,C)-ValueWhen(tr,Ref(C,-1)))/ValueWhen(tr,C);
	ls1=IIf(dls1>=Vl,ls1,Null);
	ls2=IIf(dls2>=Vl,ls2,Null);
	ls3=IIf(dls3>=Vl,ls3,Null);
	hs1=IIf(dhs1<=Vh,hs1,Null);
	hs2=IIf(dhs2<=Vh,hs2,Null);
	hs3=IIf(dhs3<=Vh,hs3,Null);
}
ls2a=IIf(BarsSince(tr)<=nbar*fact,ls2,Null);
ls2b=IIf(BarsSince(tr)>nbar*fact,ls2,Null);
ls3=IIf(BarsSince(tr)<=nbar*fact,ls3,Null);
hs2a=IIf(BarsSince(pk)<=nbar*fact,hs2,Null);
hs2b=IIf(BarsSince(pk)>nbar*fact,hs2,Null);
hs3=IIf(BarsSince(pk)<=nbar*fact,hs3,Null);
_SECTION_END();

_SECTION_BEGIN("Chart Colors");
SetChartBkColor(ParamColor("Background Color",ColorRGB(0,0,0)));
SetChartOptions(0,chartShowDates);
SetBarFillColor(IIf(C>O,ParamColor("Candle UP Color", colorGreen),IIf(C<=O,ParamColor("Candle Down Color", colorRed),colorLightGrey)));
Plot(C,"Price",IIf(C>O,ParamColor("Wick UP Color", colorDarkGreen),IIf(C<=O,ParamColor("Wick Down Color", colorDarkRed),colorLightGrey)),64,0,0,0,0);
Plot(pkh,"",colorRed,styleThick,0,0,0,-1);
Plot(trl,"",colorBrightGreen,styleThick,0,0,0,-1);
PlotShapes(shapeSmallCircle*tr,IIf(Lx-ValueWhen(tr,x)>nbar*fact,ColorRGB(0,100,0),colorWhite),0,L,-10);
PlotShapes(shapeSmallCircle*pk,IIf(Lx-ValueWhen(pk,x)>nbar*fact,ColorRGB(255,0,0),colorWhite),0,H,10);
Plot(ls1,"\nLower Trendline",colorBrightGreen,styleLine|styleNoRescale,0,0,0,-1);
Plot(ls2a,"",colorLightGrey,styleNoLine|styleDots|styleThick|styleNoRescale,0,0,0,-1);
Plot(ls2b,"",colorDarkGreen,styleNoLine|styleDots|styleThick|styleNoRescale,0,0,0,-1);
Plot(ls3,"",colorDarkGreen,styleNoLine|styleDots|styleThick|styleNoRescale,0,0,0,-1);
Plot(hs1,"\nUpper Trendline",colorRed,styleLine|styleNoRescale,0,0,0,-1);
Plot(hs2a,"",colorLightGrey,styleNoLine|styleDots|styleThick|styleNoRescale,0,0,0,-1);
Plot(hs2b,"",colorOrange,styleNoLine|styleDots|styleThick|styleNoRescale,0,0,0,-1);
Plot(hs3,"",colorOrange,styleNoLine|styleDots|styleThick|styleNoRescale,0,0,0,-1);
_SECTION_END();

if(showSignals)
{
Buy=( (!IsEmpty(Ref(hs2b,-1)) AND Ref(C<hs2b,-1)) AND (!IsEmpty(hs2b) AND C>hs2b) )
OR ( (!IsEmpty(Ref(hs3,-1)) AND Ref(C<hs3,-1)) AND (!IsEmpty(hs3) AND C>hs3) )
OR ( (!IsEmpty(Ref(hs2b,-1)) AND Ref(C<hs2b,-1)) AND (!IsEmpty(hs3) AND C>hs3) );
Buy=ExRem(Buy,tr OR pk);
BuyPrice=C;

Short=( (!IsEmpty(Ref(ls2b,-1)) AND Ref(C>ls2b,-1)) AND (!IsEmpty(ls2b) AND C<ls2b) )
OR ( (!IsEmpty(Ref(ls3,-1)) AND Ref(C>ls3,-1)) AND (!IsEmpty(ls3) AND C<ls3) )
OR ( (!IsEmpty(Ref(ls2b,-1)) AND Ref(C>ls2b,-1)) AND (!IsEmpty(ls3) AND C<ls3) );
Short=ExRem(Short,tr OR pk);
ShortPrice=C;
PlotShapes(IIf(Buy,shapeSmallUpTriangle,shapeNone),colorGreen,0,L,-15);
PlotShapes(IIf(Buy,shapeSmallCircle,shapeNone),colorWhite,0,BuyPrice,0);
PlotShapes(IIf(Short,shapeSmallDownTriangle,shapeNone),colorRed,0,H,-15);
PlotShapes(IIf(Short,shapeSmallCircle,shapeNone),colorWhite,0,ShortPrice,0);
}

qq=Interval()/60;
if(qq < 60){tf=" min";tt=qq;}
else if(qq >= 60 AND qq < 1440){tf=" hrs";tt=qq/60;}
else if(qq >= 1440){tf=" days";tt=(qq/60)/24;}
qq=Max(tfrm/60,Interval()/60);
if(qq < 60){tfa=" min";tta=qq;}
else if(qq >= 60 AND qq < 1440){tfa=" hrs";tta=qq/60;}
else if(qq >= 1440){tfa=" days";tta=(qq/60)/24;}

Title = Name() +
"\nNbar: " + nbar +
"\nChart TF: " + tt + tf +
"\nTrend TF: " + tta + tfa;

_SECTION_BEGIN("Label");
disp=ParamToggle("Display labels","Off|On",1);
dxhm=Param("Shift X Highs (Margin)",14,-100,100,1);
dxlm=Param("Shift X Lows (Margin)",10,-100,100,1);
dxh=Param("Shift X Highs",0,-100,100,1);
dxl=Param("Shift X Lows",0,-100,100,1);
dyhm=Param("Shift Y Highs (Margin)",5,-100,100,1);
dylm=Param("Shift Y Lows (Margin)",3,-100,100,1);
dyh=Param("Shift Y Highs",18,-100,100,1);
dyl=Param("Shift Y Lows",29,-100,100,1);
hm=Param("Marging High",30,-100,100,1);
lm=Param("Margin Low",30,-100,100,1);

function GetVisibleBarCount()
{
	lvb=Status("lastvisiblebar");
	fvb=Status("firstvisiblebar");
	return Min(lvb-fvb,BarCount-fvb);
}
function GfxConvertPixelsToBarX(Pixels)
{
	lvb=Status("lastvisiblebar");
	fvb=Status("firstvisiblebar");
	pxchartleft=Status("pxchartleft");
	pxchartwidth=Status("pxchartwidth");
	fac=pxchartwidth/Pixels;
	bar=(lvb-fvb)/fac;
	return bar;
}
function GfxConvertPixelToValueY(Pixels)
{
	local Miny,Maxy,pxchartbottom,pxchartheight;
	Miny=Status("axisminy");
	Maxy=Status("axismaxy");
	pxchartbottom=Status("pxchartbottom");
	pxchartheight=Status("pxchartheight");
	fac=pxchartheight/Pixels;
	Value=(Maxy-Miny)/fac;
	return Value;
}
if(disp)
{
ll=tr AND tl1<tl2;
hl=tr AND tl1>tl2;
hh=pk AND ph1>ph2;
lh=pk AND ph1<ph2;
dt=pk AND ph1==ph2;
db=tr AND tl1==tl2;

PlotShapes(shapeHollowCircle*lh,ColorRGB(255,193,193),0,H,10);
PlotShapes(shapeHollowCircle*hl,ColorRGB(202,255,112),0,L,-10);

miny=Status("axisminy");
maxy=Status("axismaxy");
AllVisibleBars=GetVisibleBarCount();
fvb=Status("firstvisiblebar");
LowMargin=Miny+GfxConvertPixelToValueY(lm);
HighMargin=Maxy-GfxConvertPixelToValueY(hm);
dyllm=GfxConvertPixelToValueY(dylm);
dyhhm=GfxConvertPixelToValueY(dyhm);
dyll=GfxConvertPixelToValueY(dyl);
dyhh=GfxConvertPixelToValueY(dyh);
dxllm=GfxConvertPixelsToBarX(dxlm);
dxhhm=GfxConvertPixelsToBarX(dxhm);
dxll=GfxConvertPixelsToBarX(dxl);
dxhh=GfxConvertPixelsToBarX(dxh);

for(i=0;i<AllVisibleBars;i++)
{
	if(ll[i+fvb] AND L[i+fvb]>LowMargin) PlotText("LL",i+fvb+dxll,L[i+fvb]-dyll,colorWhite,colorBlack);
	if(ll[i+fvb] AND L[i+fvb]<=LowMargin) PlotText("LL",i+fvb+dxll+dxllm,L[i+fvb]-dyllm,colorWhite,colorBlack);
	if(hl[i+fvb] AND L[i+fvb]>LowMargin) PlotText("HL",i+fvb+dxll,L[i+fvb]-dyll,colorWhite,colorBlack);
	if(hl[i+fvb] AND L[i+fvb]<=LowMargin) PlotText("HL",i+fvb+dxll+dxllm,L[i+fvb]-dyllm,colorWhite,colorBlack);
	if(db[i+fvb] AND L[i+fvb]>LowMargin) PlotText("DB",i+fvb+dxll,L[i+fvb]-dyll,colorWhite,colorBlack);
	if(db[i+fvb] AND L[i+fvb]<=LowMargin) PlotText("DB",i+fvb+dxll+dxllm,L[i+fvb]-dyllm,colorWhite,colorBlack);
	if(hh[i+fvb] AND H[i+fvb]<HighMargin) PlotText("HH",i+fvb+dxhh,H[i+fvb]+dyhh,colorWhite,colorBlack);
	if(hh[i+fvb] AND H[i+fvb]>=HighMargin) PlotText("HH",i+fvb+dxhh+dxhhm,H[i+fvb]+dyhhm,colorWhite,colorBlack);
	if(lh[i+fvb] AND H[i+fvb]<HighMargin) PlotText("LH",i+fvb+dxhh,H[i+fvb]+dyhh,colorWhite,colorBlack);
	if(lh[i+fvb] AND H[i+fvb]>=HighMargin) PlotText("LH",i+fvb+dxhh+dxhhm,H[i+fvb]+dyhhm,colorWhite,colorBlack);
	if(dt[i+fvb] AND H[i+fvb]<HighMargin) PlotText("DT",i+fvb+dxhh,H[i+fvb]+dyhh,colorWhite,colorBlack);
	if(dt[i+fvb] AND H[i+fvb]>=HighMargin) PlotText("DT",i+fvb+dxhh+dxhhm,H[i+fvb]+dyhhm,colorWhite,colorBlack);
}
Plot(tr,"",ColorRGB(0,100,0),styleHistogram|styleDashed|styleOwnScale|styleNoLabel,0,1,0,0);
Plot(pk,"",ColorRGB(100,0,0),styleHistogram|styleDashed|styleOwnScale|styleNoLabel,0,1,0,0);

}
_SECTION_END();
21 comments
Leave Comment
Please login here to leave a comment.
Updated the picture with an image Ed sent me.
ADMINISTRATOR THANKING YOU A MILLION AND HAVE NO WORDS TO THANK THE GENIOUS OF THE AUTHOUR ED POTTASCH.LET THE ALMIGHTY BLESS HIM AND HIS FAMILY FOR MANY MANY YEARS TO COME.ONCE AGAIN THANKING HIM FROM MY HEART.ANYBODY TRADING THE DIVERGENCES CAN GET NOTHING BETTER THEN THIS.ICING ON THE CAKE.
WARM WISHES MUNIPRASAD
Great sir,I am following this chart along with 20 ma crossover.looks good
@Edward you rule! Thank you
Great AFL. The Skills of author are extraordinary.
Also, I have seen other of his AFLs. Simply superb
My best regards for author & admnistartor for publishing this.
Viswanath
Great work! thank you
thanks for the kind remarks and vargasc1 for taking the initiative. Will soon post another interesting indicator.
pk = H>Ref(HHV,-1) AND Ref(HHV,nbar)<=H;
what does this calculate?
tr=L<Ref(LLV,-1) AND Ref(LLV,nbar)>=L;
what does this calculate?
what does pk,tr calculate ?
whats fc?tell in detail pls.
sir error 16 is coming
plz help me
Hellow,
As nbar values changes, so are the HH,LL… are changing.
I trade on hourly chart, what is correct/optimum value of Nbar setting.
Thanks
Thanx i know what is said..i want to know in detail..i want to make sure what i think is right.
if high-greater then HHV for nbars referencing previous HHV then take high as HH and if High greater then or equal to HHV reffering “n” bar and viceversa.
is it so?
why do u have to take fractals as 1,2,3.what if we take only one fractal?
error shown 16.. kindly help me or publish right code
Only two words I will use for this author extraordinary & Superb coding has excellent timing. May God bless him and you too vargasc1 for bringing it here at wisestocktrader.
Genius………………………………………..
sir error 16 is coming
plz help me
Plz help any body plz
Excellent !!!!
Thanks the author a lot.
Best wish for you
it works absolutely great!!!! thank writer
plz
any one help how to trade using this
Pls how can I download this indicator?
Great
thnx
بسیار عالی تشکر