Stoch indicator for Amibroker (AFL)
nicky about 15 years ago Amibroker (AFL)
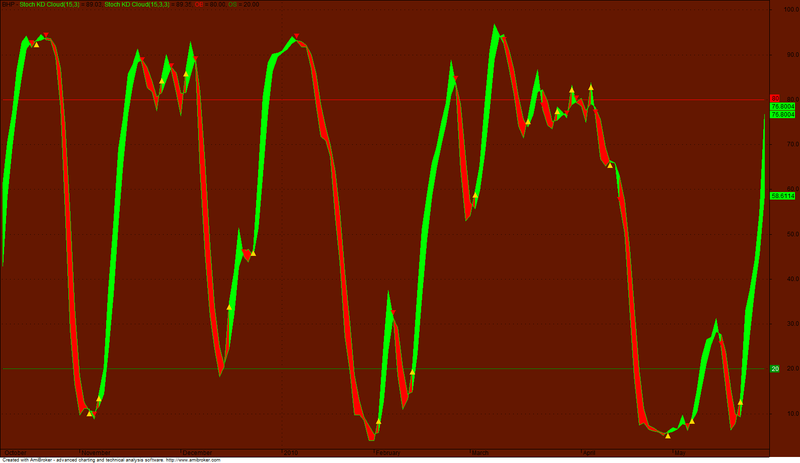
Measures position of a stock
Screenshots
Indicator / Formula
Copy & Paste Friendly
_SECTION_BEGIN( "Stoch KD Cloud" );

/*
Stochastic is an oscillator that measures the position of a stock OR security compared with its recent trading range indicating overbought OR oversold conditions.
It displays current Day price at a percentage relative to the security’s trading range (High/Low) over the specified period of time.
In a Slow Stochastic, the highs AND lows are averaged over a slowing period. The default is usually 3 for slow AND 1 (no slowing) for fast.
The line can then be smoothed using an exponential moving average, Weighted, OR simple moving average %D.
Confirming Buy/Sell signals can be read at intersections of the %D with the %K as well.

The Stochastic Oscillator always ranges between 0% AND 100%.
A reading of 0% shows that the security’s Close was the Lowest price that the security has traded during the preceding x-time periods.
A reading of 100% shows that the security’s Close was the Highest price that the security has traded during the preceding x-time periods.
When the closing price is near the top of the recent trading range (above 80%), the security is in an overbought condition AND may Signal for a possible correction.
Oversold condition exists at a point below %20. Prices Close near the top of the range during uptrends AND near the bottom of the range during downtrends.

Source: Amibroker 5.20 Help Menu

BUY = When the Stochastic is below the 20 oversold line AND the %K line crosses over the %D line.
SELL = When the Stochastic is above the 80 overbought line AND the %K line crosses below the %D line.

*/

periods = Param( "Periods", 15, 1, 200, 1 );
Ksmooth = Param( "%K Avg", 3, 1, 200, 1 );
a = StochK( periods , Ksmooth);
Plot( a, _DEFAULT_NAME(), ParamColor( "Color", colorBrightGreen ), ParamStyle("Style") );
Dsmooth = Param( "%D Avg", 3, 1, 200, 1 );
b = StochD( periods , Ksmooth, DSmooth );
Plot( b, _DEFAULT_NAME(), ParamColor( "Color", colorRed ), ParamStyle("Style") );

PlotOHLC( a,a,b,a,"", IIf(a>b, colorBrightGreen, colorRed), styleCloud);

Overbought= 80; Oversold= 20;
Plot(Overbought,"OB",colorRed);
Plot(Oversold,"OS",colorGreen);

Buy = Cross( a, b );
Sell = Cross( b, a );
PlotShapes( shapeSmallUpTriangle * Buy + shapeSmallDownTriangle * Sell, IIf( Buy, colorGold, colorRed ) );

_SECTION_END();

_SECTION_BEGIN("Animated_BackGround_");
// http://amibrokertraders.blogspot.com //
//====================

for( i = 1; i < BarCount; i++ )
z = (GetPerformanceCounter()/100)%256;
anim=ColorHSB( ( i + z ) % 256, 255, 100 );
SetChartBkColor(anim);
RequestTimedRefresh(1);

//====================
_SECTION_END();
0 comments
Leave Comment
Please login here to leave a comment.