MACD with colored Histogram for Amibroker (AFL)
ahmmad about 15 years ago Amibroker (AFL)
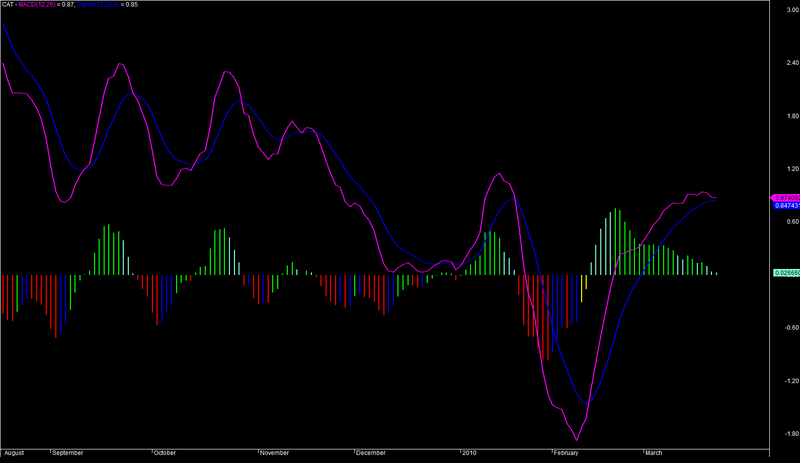
12,26,9 Days MACD And Signal is Ploted ,With it Colored Histogram is also Ploted.
Screenshots
Indicator / Formula
Copy & Paste Friendly
_SECTION_BEGIN("MACD");

r1 = Param( "Fast avg", 12, 2, 200, 1 );
r2 = Param( "Slow avg", 26, 2, 200, 1 );
r3 = Param( "Signal avg", 9, 2, 200, 1 );
Plot( ml = MACD(r1, r2), StrFormat(_SECTION_NAME()+"(%g,%g)", r1, r2), ParamColor("MACD color", colorCustom12 ), ParamStyle("MACD style", 0 | 0 | styleThick, 0  ) );
Plot( sl = Signal(r1,r2,r3), "Signal" + _PARAM_VALUES(), ParamColor("Signal color", colorBlue
 ), ParamStyle("Signal style", 0 | 0 | styleThick, 0  ) );a=(ml-sl);a1=Ref(a,-1);//colorCustom11

Color = IIf (ml>0 AND ml>Ref(ml,-1), 5,IIf (a < a1 AND ml<sl,4,IIf (a < 0 AND ml>Ref(ml,-1),colorYellow,IIf (a > 0 ,colorAqua,6))));
Plot( ml-sl, "MACD Histogram", color, styleNoTitle | ParamStyle("Histogram style", styleHistogram | styleThick, maskHistogram ) );//styleNoLabel|

if( Status("action") == actionCommentary )
{
Buy=Cross( ml, sl ) OR Cross((ml+ml), sl );
Sell = Cross( sl, ml );

printf("\nMACD Value: " + WriteVal( ml )+
", Signal Line: " + WriteVal( sl ));

printf("\n\nThe MACD can provide buy/sell indications in three ways, signal line crossovers, overbought/oversold conditions, and divergences.\n");


printf("\n\nCrossovers:\n");
printf("\nCurrently the MACD is "+
WriteIf(MACD() > Signal(),"bullish","bearish")+
" since it is trading "+
WriteIf(MACD() > Signal(),"above","below")+
" its signal line.");


printf("\nThe MACD crossed "+
WriteIf(MACD() > Signal(),"above","below")+
" its signal line "+
WriteVal( Min( BarsSince( Cross( MACD(), Signal() )), BarsSince( Cross( Signal(), MACD()))), 0.0)+
" period(s) ago.");

bars=SelectedValue(Min( BarsSince( Cross( MACD(), Signal() )), BarsSince( Cross( Signal(), MACD())) ));

prevclose=Ref(Close,-bars);

printf("\nSince the MACD crossed its moving average, "+
Name()+"'s price has "+
WriteIf(Close>prevclose,"increased ","decreased ")+
WriteVal(100*(Close-prevclose)/prevclose) + "%");

printf("\nAnd has ranged from a high of "+
WriteVal(HHV(High,bars+1),6.3)+
" to a low of "+
WriteVal(LLV(Low,bars+1),6.3));

printf("\n\nOverbought/Oversold:");
Osc = OscP( 12, 26 );
Osc1 = Ref( Osc, -1 );
Osc5 = Ref( Osc, -5 );

printf("\n"+WriteIf( Osc <= -3 AND ( Osc - Osc5 ) == -Sum( abs( Osc - Osc1 ), 5 ),
"The MACD is in an oversold range. Prices may continue to move lower for some time.  Wait for prices to move higher before considering any long positions.",
WriteIf( Osc >= 3 AND ( Osc - Osc5 ) ==  Sum( abs( Osc - Osc1 ), 5 ),
"The MACD is in an overbought range.  Prices may continue to move higher for some time.  Wait for prices to move lower before considering any short positions.",
"The MACD is not in an Overbought/Oversold range.")));

printf("\n\nDivergence:\n");
temp = Trough(Low, 2, 1) < 0.96 * Ref( Trough(Low, 2, 1), -1) AND ValueWhen( Trough(Low, 2, 1) != Ref( Trough(Low, 2, 1), -1 ), MACD(), 1 ) >= 0.90 * ValueWhen( Trough( Low, 2, 1) != Ref( Trough( Low, 2, 1), -1 ), MACD(), 2 ) AND MACD() < 0;

temp2= Peak(  High,2, 1) > 1.04 * Ref( Peak( High, 2, 1), -1) AND ValueWhen( Peak( High, 2, 1) != Ref( Peak( High, 2, 1), -1 ), MACD(), 1 ) <= 0.90 * ValueWhen( Peak(  High, 2, 1) != Ref( Peak(  High, 2, 1), -1 ), MACD(), 2 ) AND MACD() > 0;

printf(WriteIf( HHV( temp, 5 ) == 1,"A bullish divergence occurred " + WriteVal( BarsSince( temp ), 1.0 ) +
" period(s) ago. Wait for upward price movement for confirmation before considering any long positions.",
WriteIf( HHV( temp2,5) == 1,
"A bearish divergence occurred " +
WriteVal( BarsSince( temp2 ), 1.0 ) +
" period(s) ago.  Wait for downward price movement for confirmation before considering any short positions.",
"There have been no divergence signals within the last 5 periods." ) ));

printf("\n\nThis commentary is not a recommendation to buy or sell. Use at your own risk.");
}

Buy=Cross( ml, sl ) OR Cross((ml+ml), sl );
_SECTION_END();
0 comments
Leave Comment
Please login here to leave a comment.