Pivots for Amibroker (AFL)
morgen about 15 years ago Amibroker (AFL)
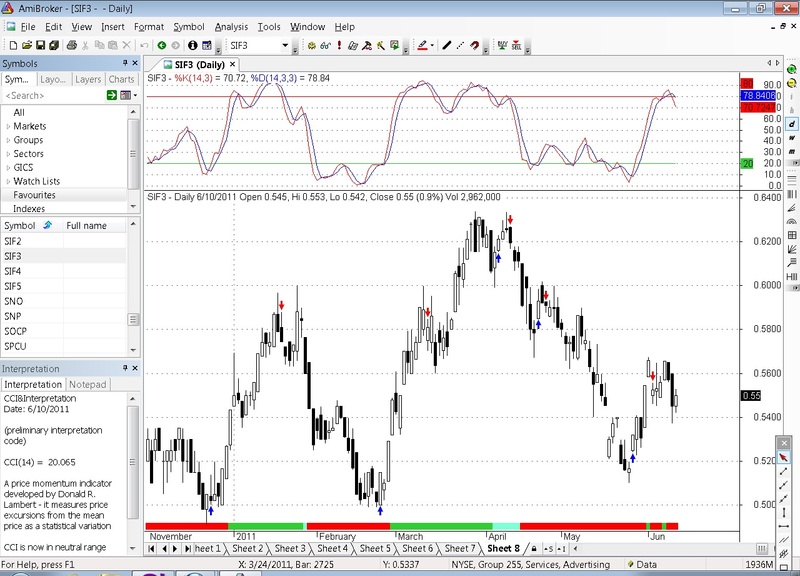
Simply pivots!
Screenshots
Indicator / Formula
Copy & Paste Friendly
//PIVOTS
///////////

pivbuy=  Ref(L,-1)<Ref(L,-2) AND L>Ref(L,-1) AND Ref(H,-1)<Ref(H,-2) AND H>Ref(H,-1) AND C>Ref(C,-2) ;
pivsell= Ref(H,-1)>Ref(H,-2) AND H<Ref(H,-1) AND Ref(L,-1)>Ref(L,-2) AND L<Ref(L,-1) AND C<Ref(C,-2) ;

Buy  = pivbuy ;
Sell = pivsell ;

Buy= ExRem(Buy,Sell) ;
Sell= ExRem(Sell,Buy) ;

PlotShapes(IIf(Buy,shapeUpArrow,shapeNone),colorBlue,0,L,Offset=-10);
PlotShapes(IIf(Sell,shapeDownArrow,shapeNone),colorRed,0,H,Offset=-10);
//xxxxxxxxxxxxxxxxxxxxxxxxxxxxxxxxxxxxxxxxxxxxxxxxxxxxxxxxxxxxxxxxxxxxxxxxxxxxxxxxxxxxxxxxxxx

//PRICE
_SECTION_BEGIN("Price");
SetChartOptions(0,chartShowArrows|chartShowDates);
_N(Title = StrFormat("{{NAME}} - {{INTERVAL}} {{DATE}} Open %g, Hi %g, Lo %g, Close %g (%.1f%%) Vol " +WriteVal( V, 1.0 ) +
          " {{VALUES}}", O, H, L, C, SelectedValue( ROC( C, 1 )) ));
Plot( C, "Close", ParamColor("Color", colorBlack ), styleNoTitle | ParamStyle("Style") | GetPriceStyle() );
if( ParamToggle("Tooltip shows", "All Values|Only Prices" ) )
{
 ToolTip=StrFormat("Open: %g\nHigh:  %g\nLow:   %g\nClose:  %g (%.1f%%)\nVolume: "+NumToStr( V, 1 ), O, H, L, C,
         SelectedValue( ROC( C, 1 )));
}
_SECTION_END();
//xxxxxxxxxxxxxxxxxxxxxxxxxxxxxxxxxxxxxxxxxxxxxxxxxxxxxxxxxxxxxxxxxxxxxxxxxxxxxxxxxxxxxxxxxxxxxx

//TRENDING RIBBON
// Paste the code below to your price chart somewhere and green ribbon means both
// both MACD and ADX trending up so if the red ribbon shows up the MACD and the ADX
// are both trending down.
_SECTION_BEGIN("trending ribbon");
uptrend= PDI()>MDI() AND MACD()>Signal() ;
downtrend= MDI()>PDI() AND Signal()>MACD() ;
Plot( 2, /* defines the height of the ribbon in percent of pane width */"",
IIf( uptrend AND EMA(C,50)>=Ref(EMA(C,50),-1), colorLime, IIf( downtrend OR EMA(C,50)<Ref(EMA(C,50),-1),
     colorRed, colorAqua )), /* choose color */
styleOwnScale|styleArea|styleNoLabel, -0.5, 100 );
_SECTION_END();
//xxxxxxxxxxxxxxxxxxxxxxxxxxxxxxxxxxxxxxxxxxxxxxxxxxxxxxxxxxxxxxxxxxxxxxxxxxxxxxxxxxxxxxxxxxxxxxxxxxxxxxx
4 comments
Leave Comment
Please login here to leave a comment.
excelent , simplu si util .FELICITARI
Excellent, simple and useful. CONGRATULATIONS
Multumesc frumos,gtudor.
Recommend:
Buy= pivbuy and c>o ;
fine