Visual Trader for Amibroker (AFL)
Rakesh Kumar about 15 years ago Amibroker (AFL)
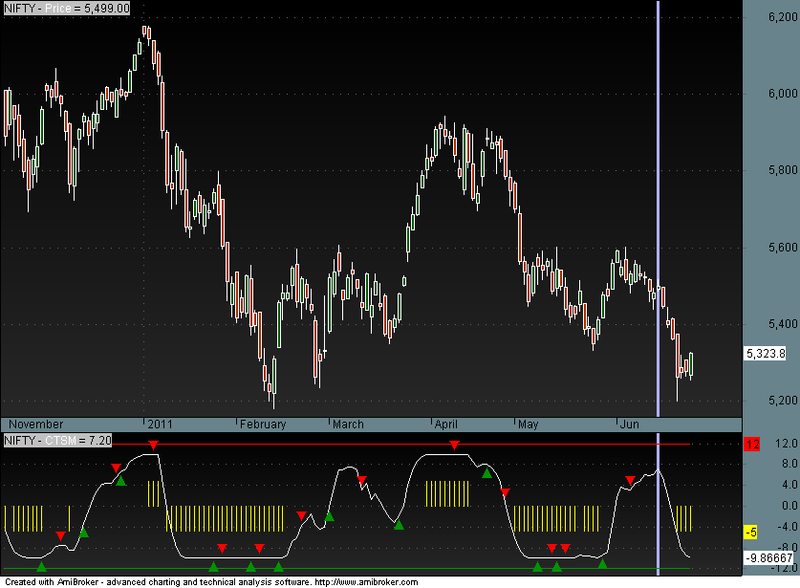
This indicator shows oversold/overbought/sideway market with Enter/Exit point. May be use for Day Trading & Intra Day Trading.
Screenshots
Indicator / Formula
Copy & Paste Friendly
_SECTION_BEGIN("Background_Setting");
SetChartBkGradientFill( ParamColor("BgTop", colorBlack),
ParamColor("BgBottom", colorDarkGrey),ParamColor("TitleBack",colorLightGrey));
SetChartBkColor(ParamColor("Outer Panel",colorPaleBlue));
_SECTION_END();

_SECTION_BEGIN("Visual TRADER");
SmoothingPeriod = 5;

CTS=IIf(C>=Ref(C,-11),1,-1)+IIf(C>=Ref(C,-12),1,-1)+IIf(C>=Ref(C,-13),1,-1)+IIf(C>=Ref(C,-14),1,-1)+IIf(C>=Ref(C,-15),1,-1)+IIf(C>=Ref(C,-16),1,-1)+IIf(C>=Ref(C,-17),1,-1)+IIf(C>=Ref(C,-18),1,-1)+IIf(C>=Ref(C,-19),1,-1)+IIf(C>=Ref(C,-20),1,-1);

CTSM = WMA(CTS,SmoothingPeriod);
Histo = IIf(CTSM==10,5,IIf(CTS==-10,-5,Null));

Plot(CTSM, "CTSM", colorWhite, styleLine );
Plot(Histo, "", colorYellow, styleHistogram );

Plot(12,"",colorRed,styleLine);
Plot(-12,"",colorGreen,styleLine);
_SECTION_END();

_SECTION_BEGIN("Trend arrow");
n= Param("No. of Bars",3,2,8,1);
TrendUp = H > Ref(HHV(H,n),-1);
TrendDn = L < Ref(LLV(L,n),-1);
TrendUp = ExRem(TrendUp,TrendDn);
TrendDn = ExRem(TrendDn,TrendUp);
PlotShapes(TrendUp*shapeSmallUpTriangle,colorGreen);
PlotShapes(TrendDn*shapeSmallDownTriangle,colorRed);
_SECTION_END();
0 comments
Leave Comment
Please login here to leave a comment.