Buy & UP for Amibroker (AFL)
morgen about 15 years ago Amibroker (AFL)
This is something simple.
Buy at the beginning of a trend with strong crossovers.
UP is a strong up Japanese Candlestick.
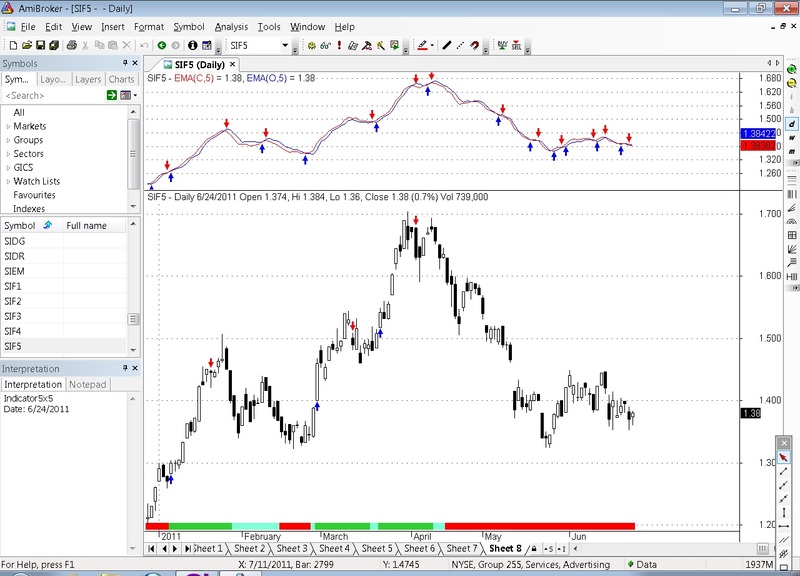
Screenshots
Indicator / Formula
Copy & Paste Friendly
//PRICE
_SECTION_BEGIN("Price");
SetChartOptions(0,chartShowArrows|chartShowDates);
_N(Title = StrFormat("{{NAME}} - {{INTERVAL}} {{DATE}} Open %g, Hi %g, Lo %g, Close %g (%.1f%%) Vol " +
           WriteVal( V, 1.0 ) + " {{VALUES}}", O, H, L, C, SelectedValue( ROC( C, 1 )) ));
Plot( C, "Close", ParamColor("Color", colorBlack ), styleNoTitle | ParamStyle("Style") | GetPriceStyle() );
if( ParamToggle("Tooltip shows", "All Values|Only Prices" ) )
{
 ToolTip=StrFormat("Open: %g\nHigh:  %g\nLow:   %g\nClose:  %g (%.1f%%)\nVolume: "+NumToStr( V, 1 ), O, H, L, C,
         SelectedValue( ROC( C, 1 )));
}
_SECTION_END();
//xxxxxxxxxxxxxxxxxxxxxxxxxxxxxxxxxxxxxxxxxxxxxxxxxxxxxxxxxxxxxxxxxxxxxxxxxxxxxxxxxxxxxxxxxxxxxx

//TRENDING RIBBON
// Paste the code below to your price chart somewhere and green ribbon means both
// both MACD and ADX trending up so if the red ribbon shows up the MACD and the ADX
// are both trending down.
_SECTION_BEGIN("trending ribbon");
uptrend= PDI()>MDI() AND MACD()>Signal() ;
downtrend= MDI()>PDI() AND Signal()>MACD() ;
Plot( 2, /* defines the height of the ribbon in percent of pane width */"",
IIf( uptrend AND EMA(C,50)>=Ref(EMA(C,50),-1), colorLime, IIf( downtrend OR EMA(C,50)<Ref(EMA(C,50),-1),
     colorRed, colorAqua )), /* choose color */
styleOwnScale|styleArea|styleNoLabel, -0.5, 100 );
_SECTION_END();
//xxxxxxxxxxxxxxxxxxxxxxxxxxxxxxxxxxxxxxxxxxxxxxxxxxxxxxxxxxxxxxxxxxxxxxxxxxxxxxxxxxxxxxxxxxxxxxxxxxxxxxx

//FORMULE
Cuptop1= C>BBandTop( C,20,1 ) ;
top1up= BBandTop( C,20,1 )>=Ref(BBandTop( C,20,1 ),-1) ;
top2up= BBandTop( C,20,2 )>=Ref(BBandTop( C,20,2 ),-1) ;
MACDup= MACD()>Signal() ;
Hist= MACD()-Signal() ;
Histup= Hist>Ref(Hist,-1) ;
stochup= StochK()>StochD() ;
stoch80= StochK()<80 ;
stoch50= StochK()<50 ;
MFIup= MFI()>EMA(MFI(),5) AND MFI()>20 ;
ma10up= MA(C,10)>=Ref(MA(C,10),-1) ;
ma20up= MA(C,20)>=Ref(MA(C,20),-1) ;
EMA50up= EMA(C,50)>=Ref(EMA(C,50),-1) ;
Cupma10= C>MA(C,10) ;
Cupma20= C>MA(C,20) ;
cupema50= C>EMA(C,50) ;
Vup50= V>50000 ;
CCIup0= CCI()>0 ;
Cupo= C>O ;
ADXup= ADX()>Ref(ADX(),-1) ;
ADX45= ADX()<45 ;
aa= O+H+L+C ;
UP= aa>Ref(aa,-1) ;
//xxxxxxxxxxxxxxxxxxxxxxxxxxxxxxxxxxxxxxxxxxxxxxxxxxxxxxxxxxxxxxxxxxxxxxxxxxxxxxxxxxxxxxxxxxxxx


mybuy= Cross(aa,Ref(aa,-1)) AND macdup AND Histup AND stochup AND vup50 AND MFIup AND ema50up AND ma20up OR
       Cross(MACD(),Signal()) AND UP AND Histup AND stochup AND vup50 AND MFIup AND ema50up AND ma20up OR
       Cross(PDI(),MDI()) AND UP AND macdup AND Histup AND stochup AND vup50 AND MFIup AND ema50up AND ma20up OR
       Cross(StochK(),StochD()) AND stoch50 AND UP AND macdup AND Histup AND vup50 AND MFIup AND ema50up AND ma20up ;
myshort= Cross(Ref(aa,-1),aa) AND !histup AND !stochup OR
         Cross(Signal(),MACD()) AND !UP AND !stochup ;

Buy = ExRem(myBuy, myShort);
Sell = ExRem(myShort, myBuy);

PlotShapes(IIf(Buy,shapeUpArrow,shapeNone),colorBlue,0,L,Offset=-10);
PlotShapes(IIf(Sell,shapeDownArrow,shapeNone),colorRed,0,H,Offset=-10);
//xxxxxxxxxxxxxxxxxxxxxxxxxxxxxxxxxxxxxxxxxxxxxxxxxxxxxxxxxxxxxxxxxxxxxxxxxxxxxxxxxxxxx
2 comments
Leave Comment
Please login here to leave a comment.
it is not showing buy sell arrows as shown in the pic
It works fine.
It has a filter= vup50 means it is showing buy arrows only for V>50000.