Waves in Price for Amibroker (AFL)
has001u about 15 years ago Amibroker (AFL)
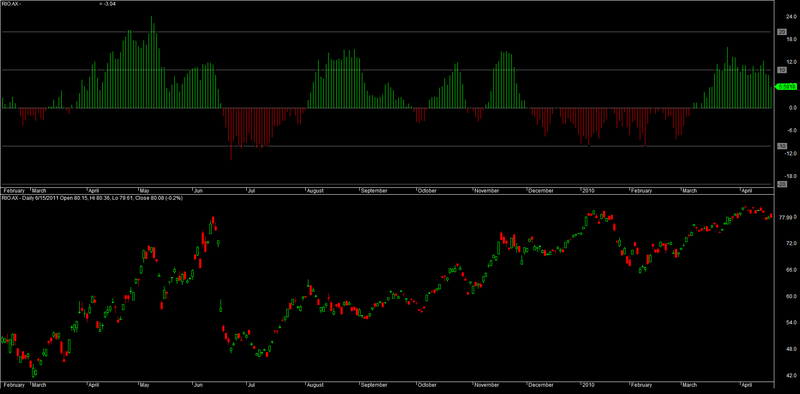
IMO the MOST important level on any indicator is the neutral level,
where bullishness equates to bearishness. I like it to be in the middle
of the pane. It’s just easy on the eyes. In the DVB it is at Zero.
Screenshots
Indicator / Formula
Copy & Paste Friendly
_SECTION_BEGIN("Volume Waves");
// I next set up the Period Parameter (more about the selected setting later)
periods = Param("Periods", 34, 1, 200, 1 ) ;

/* and utilised Sum() to total the bull and bear Volume over the number
of days/bars that I specified. */

BulldayVol= ( Sum( IIf( C>=Ref(C,-1), V, 0), periods)) / periods ;
BeardayVol= ( Sum( IIf( Ref(C,-1)>=C, V, 0), periods)) / periods ;

/* I then manipulated the formula to get an oscillator. Don't get hung up
trying to understand this. It's just a method of combining and displaying
bullish & bearish Volume data as an oscillator. Not that Important! */

TheDowVolumeBigot= 100-(100/(1+(BulldayVol/BearDayVol)))-50;


Plot(TheDowVolumeBigot,"       THE DOW VOLUME BIGOT   ",1,4+styleNoLabel);
/* I plot the DVB line in bold black so it is prominent. I do this to
ensure I don't view the indicator as just as a "bull/bear area" oscillator.
The Black Bigot line has inherent qualities of its own. I now get some value
by occaisionally plotting trendlines on it and looking for trend line breaks,
as well as divergence. */

/* I plot the DVB again as a histogram with green for >0 (bullish) and
red for <0 (bearish) */
Colour= IIf(TheDowVolumeBigot>0,8,4);
Plot( TheDowVolumeBigot,"",Colour,2);

Plot(0,"",colorGrey50,styleNoLabel); // The important Neutral level

// The method of displaying the DVB gives precise action levels.
Plot(10,"",colorGrey50); Plot(-10,"",colorGrey50);
Plot(20,"",colorGrey50); Plot(-20,"",colorGrey50);
_SECTION_END();
0 comments
Leave Comment
Please login here to leave a comment.