Trix Bars number for Amibroker (AFL)
nmalpani16 almost 15 years ago Amibroker (AFL)
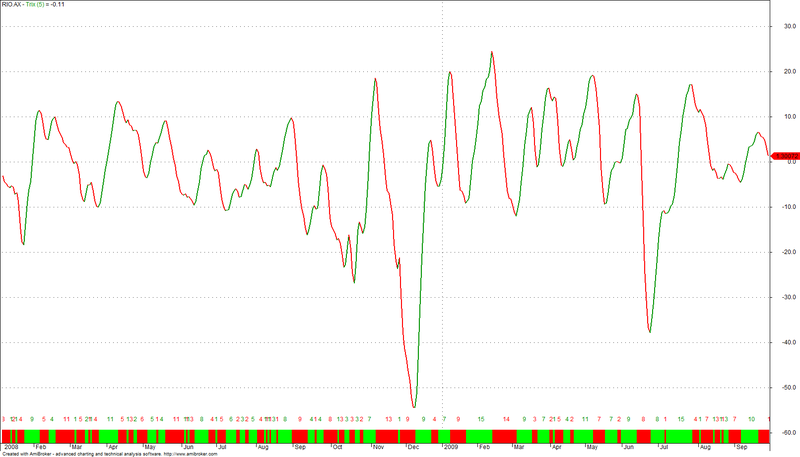
1.Trix Bars number for each swing
2.Trix’s ribbon
3. plot a text at 5% from bottom’s pane
Screenshots
Indicator / Formula
Copy & Paste Friendly
//	Trix Bars number

//	Trix Bars number for each swing

periods = Param( "Periods", 5, 2, 200, 1 );
TrixOnClose = Trix( periods );

uptx = TrixOnClose >= Ref( TrixOnClose, -1 );
dntx = TrixOnClose <= Ref( TrixOnClose, -1 );

Peaktrix = TrixOnClose > Ref( TrixOnClose, -1 )AND TrixOnClose > Ref( TrixOnClose, 1 );
Troughtrix = TrixOnClose < Ref( TrixOnClose, -1 )AND TrixOnClose < Ref( TrixOnClose, 1 ) ;

BarsUp = BarsSince( dntx );
BarsDn = BarsSince( uptx );

Colortx = IIf( uptx , colorGreen, IIf( dntx , colorRed, colorGreen ) );

Plot( TrixOnClose, "Trix (" + periods + ")" , Colortx, styleThick );

// Trix's ribbon
Ribbon = IIf( uptx , colorBrightGreen, IIf( dntx , colorRed, colorBrightGreen ) );
Plot( 3, "", Ribbon , styleOwnScale | styleArea | styleNoLabel, 0, 100 );

// plot a text at 5% from bottom's pane
percent = Param( "PositText%", 5, 2, 90, 0.5 );
Miny = Status( "axisminy" );
Maxy = Status( "axismaxy" );
y = Miny +  ( Maxy - Miny ) * percent / 100; // at 5 % above bottom of the pane

for ( i = 0; i < BarCount; i++ )
{
    if ( Peaktrix [i] )
        PlotText( "" + BarsUp [ i ], i - BarsUp [ i ] / 2 + 1, y, colorGreen );

    if ( Troughtrix [i] )
        PlotText( "" + BarsDn [ i ], i - BarsDn [ i ] / 2 + 1, y, colorRed );
}

GraphXSpace = 10;
0 comments
Leave Comment
Please login here to leave a comment.