COMBO for Amibroker (AFL)
lkokin almost 15 years ago Amibroker (AFL)
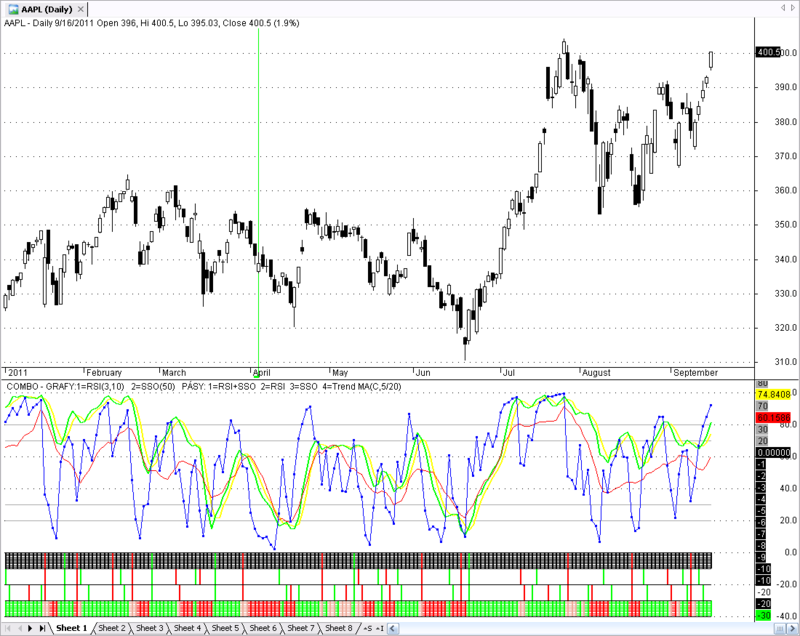
I came across this interesting indicator by Tom Supera. It shows trend and turning points.
The first 3 bands on the bottom show turning points. When all 3 are red, or green, this is a strong indication of a turning point.
The 4th band on the bottom is green, the trend is up. When it is red, the trend is down.
Screenshots
Indicator / Formula
Copy & Paste Friendly
//------------------------------------------------------------------------------
//
//  Excuse my English. Text is write for programme PC TRANSLATOR.This indicator
//  not given clear purchase and selling signals. Signals is necessary take
//  only like possible turning point. Already long time investigation different
//  indicator and get I am to findings, that movement stock isn't forward
//  possible estimate along none of they.Beyond even any share go up and no go
//  down, as long as oneself near she there were no signal indicator. Growth
//  stock is that is dependent only for mood investors and stag and for her no
//  indicator there's not.
//
//  Indicator show only possible turning point. It if turn faces to turn trend,
//  correction and or go about false signal can be find out only by return.
//  Nevertheless yourself I think, that is important indicator track.
//  Experience oneself that is appreciation signal value do good and as far as
//  have you in addition needed dues luck, you can drive a good bargain.
//
//  Indicator: This indicator work with very short RSI, long SSO and simple
//  moving average. RSI be instrumental to conciliation signals. STOCHASTIC is
//  there together with moving average take like indicator trend. Below graph
//  are band which reflect signals and trend along SMA.
//
//  1.Band : Common signals RSI and SSO (have not major weight than independent
//  signal from RSI)
//
//  2.Band : Signals RSI
//
//  3.Band : Signals SSO
//
//  4.Band : Trend along MA ( green light = weak bullish trend, green = strong
//  bullish trend, light red % = weak bear trend -possible turnover bullish
//  trend for bear, red = strong bear trend )
//
//  Isn't right in trades ranges.
//
//  PS : According to the of my is needless look for perfect strategy because
//  simply any there's not. To good deals faces only experienced eye, good
//  smell , arrogance and self-assured. If those so it has not been, no live
//  would businessmen in stress and it has not been would from broker firm
//  leakage. Hope that by means of these indicator, and isn't necessary use
//  just me election indices, you can get good eye, It the others is for you.
//  God preserve madman, who oneself decision make money for exchange.
//
//  !!!Scaling: CUSTOM -40 and 110; Gird lines 50 !!!
//
//------------------------------------------------------------------------------


//XXXXXXXXXXXXXXXXXXX COMBO XXXXXXXXXXXXXXXXXXXXXXXXXXXXXXXXXXXXXXXXXXXXXXXXXXXXXXXX
//!!!Scaling: CUSTOM -40 and 110; Gird lines 50 !!!
MaxGraph=200;
GraphXSpace=1;
//XXXXXXXXXXXXXXXXXXX Podmínky grafu XXXXXXXXXXXXXXXXXXXXXXXXXXXXXXXXXXXXXXXXXXXXXXX
TI  =   3 ;              TS  = 10 ;  // Délka RSI (long for RSI and MA RSI)
D3  =   50 ;                         // SSO   (long for SSO)

//_________Graf 1___________________________________________________________________
IND   = RSI ( TI  ) ;             SIG   = MA ( RSI ( TI ) , TS  ) ;
IND2  = StochK(D3);               SIG2  = StochD(D3);
//==================== Buy conditionsNákupní podmínky (Buy conditions)==============
//________ Ke grafu 1_______________________________________________________________
BP  = Cross ( IND  , SIG  );     // Nákup RSI    Buy RSI
BP2 = Cross ( IND2 , SIG2 );     // Nákup SSO    Buy SSO

SP  = Cross ( SIG  , IND  );     // Prodej RSI   Sell RSI
SP2 = Cross ( SIG2 , IND2 );     // Prodej RSI   Sell SSO

B   = BP AND BP2;                // Nákup RSI + SSO Buy RSI + SSO
S   = SP AND SP2;                // Prodej RSI + SSO Sell RSI + SSO
//________ TREND podle MA(C,20) ____________________________________________________
F1 = 5  ;                         // Délka krátkého MA Long for short MA
F2 = 20 ;                         // Délka dlouhého MA Long for long MA
TM   = MA  ( C , F1 ) ;           // 5 denní MA ze záverecné ceny
TM2  = MA  ( C , F2 ) ;           // 20 denní MA ze záverecné ceny
UTM = IIf(C>TM AND C<TM2,8,IIf(C>TM AND C>TM2,5,IIf(C<TM AND C>TM2,13,IIf(C<TM AND C<TM2,4,2))));                    // Klasifikace síly trendu

//XXXXXXXXXXXXXXXXXXXXX VZOREC GRAFU XXXXXXXXXXXXXXXXXXXXXXXXXXXXXXXXXXXXXXXXXXXXXXX
//________ GRAF ____________________________________________________________________

Graph0   = IND  ;  Graph0Color =  6 ; Graph0Style = 8 ; //Indikátor RSI
Graph1   = SIG  ;  Graph1Color =  4 ; Graph1Style = 1 ; //Signál RSI
Graph2   = IND2 ;  Graph2Color =  8 ; Graph2Style = 4 ; //Indikátor SSO
Graph3   = SIG2 ;  Graph3Color =  7 ; Graph3Style = 4 ; //Signál SSO
Graph4   = 30   ;  Graph4Color =  0 ; Graph4Style = 4 ; //Pásmo preprodanosti RSI
Graph5   = 70   ;  Graph5Color =  0 ; Graph5Style = 4 ; //Pásmo prekoupenosti RSI
Graph6   = 20   ;  Graph6Color =  0 ; Graph6Style = 4 ; //Pásmo preprodanosti SSO
Graph7   = 80   ;  Graph7Color =  0 ; Graph7Style = 4 ; //Pásmo prekoupenosti SSO
//________ PÁSY ____________________________________________________________________
Graph50 = -10 ; Graph50Style = 4+2 ; Graph50BarColor = IIf(B,5,IIf(S,4,1));
Graph51 = -20 ; Graph51Style = 4+2 ; Graph51BarColor = IIf(BP,5,IIf(SP,4,2));
Graph52 = -30 ; Graph52Style = 4+2 ; Graph52BarColor = IIf(BP2,5,IIf(SP2,4,2));
Graph53 = -40 ; Graph53Style = 4+2 ; Graph53BarColor = UTM;
//________ Rozdìlení pásù __________________________________________________________
Graph10 =   0 ; Graph10Style = 4;    Graph10Color = 1;  //Rozdelení pásu
Graph11 = -10 ; Graph11Style = 4;    Graph11Color = 1;  //Rozdelení pásu
Graph12 = -20 ; Graph12Style = 4;    Graph12Color = 1;  //Rozdelení pásu
Graph13 = -30 ; Graph13Style = 4;    Graph13Color = 1;  //Rozdelení pásu
Graph14 = -40 ; Graph14Style = 4;    Graph14Color = 1;  //Rozdelení pásu
//________ Probarvení pásu _________________________________________________________
Graph150 =  -1 ;Graph150Style = 4 ; Graph150color=1;
Graph151 =  -2 ;Graph151Style = 4 ; Graph151color=1;
Graph152 =  -3 ;Graph152Style = 4 ; Graph152color=1;
Graph153 =  -4 ;Graph153Style = 4 ; Graph153color=1;
Graph154 =  -5 ;Graph154Style = 4 ; Graph154color=1;
Graph155 =  -6 ;Graph155Style = 4 ; Graph155color=1;
Graph156 =  -7 ;Graph156Style = 4 ; Graph156color=1;
Graph157 =  -8 ;Graph157Style = 4 ; Graph157color=1;
Graph158 =  -9 ;Graph158Style = 4 ; Graph158Color=1;

Graph160 =  -30 ;Graph160Style = 4 ; Graph160Barcolor=UTM;
Graph161 =  -31 ;Graph161Style = 4 ; Graph161Barcolor=UTM;
Graph162 =  -32 ;Graph162Style = 4 ; Graph162Barcolor=UTM;
Graph163 =  -33 ;Graph163Style = 4 ; Graph163Barcolor=UTM;
Graph164 =  -34 ;Graph164Style = 4 ; Graph164Barcolor=UTM;
Graph165 =  -35 ;Graph165Style = 4 ; Graph165Barcolor=UTM;
Graph166 =  -36 ;Graph166Style = 4 ; Graph166Barcolor=UTM;
Graph167 =  -37 ;Graph167Style = 4 ; Graph167Barcolor=UTM;
Graph168 =  -38 ;Graph168Style = 4 ; Graph168BarColor=UTM;
Graph169 =  -39 ;Graph169Style = 4 ; Graph169BarColor=UTM;
//XXXXXXXXXXXXXXXXXXX TEXT XXXXXXXXXXXXXXXXXXXXXXXXXXXXXXXXXXXXXXXXXXXXXXXXXXXXXXXX
Title=" COMBO - GRAFY:1=RSI("+WriteVal(TI,format=1.0)+","+WriteVal(TS,format=1.0)+")"
+"   2=SSO("+WriteVal(D3,format=1.0)+")"
+"   PÁSY: 1=RSI+SSO  2=RSI  3=SSO  4=Trend MA(C,"+WriteVal(F1,format=1.0)+"/"+WriteVal(F2,format=1.0)+") ";
//XXXXXXXXXXXXXXXXXXX EXPLORE XXXXXXXXXXXXXXXXXXXXXXXXXXXXXXXXXXXXXXXXXXXXXXXXXXXXXX
Filter= BP;
NumColumns=3;
TB  = C > MA(C,20);

Column0 = BP  ; Column0Name = "SIGNÁL RSI"  ; Column0Format = 1.0 ;
Column1 = TB  ; Column1Name = "TREND BULL"  ; Column1Format = 1.0 ;
Column2 = C   ; Column2Name = "CLOSE"       ; Column2Format = 1.2 ;
//XXXXXXXXXXXXXXXXXXX COMBO XXXXXXXXXXXXXXXXXXXXXXXXXXXXXXXXXXXXXXXXXXXXXXXXXXXXXXXX
MaxGraph=200;
GraphXSpace=1;
//XXXXXXXXXXXXXXXXXXX Podmínky grafu XXXXXXXXXXXXXXXXXXXXXXXXXXXXXXXXXXXXXXXXXXXXXXX
TI  =   3 ;              TS  = 10 ;  // Délka
D3  =   50 ;                         // SSO

//_________Graf 1___________________________________________________________________
IND   = RSI ( TI  ) ;             SIG   = MA ( RSI ( TI ) , TS  ) ;
IND2  = StochK(D3);               SIG2  = StochD(D3);
//==================== Nákupní podmínky ============================================
//________ Ke grafu 1_______________________________________________________________
BP  = Cross ( IND  , SIG  );     // Nákup RSI
BP2 = Cross ( IND2 , SIG2 );     // Nákup SSO

SP  = Cross ( SIG  , IND  );     // Prodej RSI
SP2 = Cross ( SIG2 , IND2 );     // Prodej RSI

B   = BP AND BP2;                // Nákup RSI + SSO
S   = SP AND SP2;                // Prodej RSI + SSO
//________ TREND podle MA(C,20) ____________________________________________________
F1 = 5  ;                         // Délka krátkého MA
F2 = 20 ;                         // Délka dlouhého MA
TM   = MA  ( C , F1 ) ;           // 5 denní MA ze záverecné ceny
TM2  = MA  ( C , F2 ) ;           // 20 denní MA ze záverecné ceny
UTM = IIf(C>TM AND C<TM2,8,IIf(C>TM AND C>TM2,5,IIf(C<TM AND C>TM2,13,IIf(C<TM AND C<TM2,4,2))));                    // Klasifikace síly trendu

//XXXXXXXXXXXXXXXXXXXXX VZOREC GRAFU XXXXXXXXXXXXXXXXXXXXXXXXXXXXXXXXXXXXXXXXXXXXXXX
//________ GRAF ____________________________________________________________________

Graph0   = IND  ;  Graph0Color =  6 ; Graph0Style = 8 ; //Indikátor RSI
Graph1   = SIG  ;  Graph1Color =  4 ; Graph1Style = 1 ; //Signál RSI
Graph2   = IND2 ;  Graph2Color =  8 ; Graph2Style = 4 ; //Indikátor SSO
Graph3   = SIG2 ;  Graph3Color =  7 ; Graph3Style = 4 ; //Signál SSO
Graph4   = 30   ;  Graph4Color =  0 ; Graph4Style = 4 ; //Pásmo preprodanosti RSI
Graph5   = 70   ;  Graph5Color =  0 ; Graph5Style = 4 ; //Pásmo prekoupenosti RSI
Graph6   = 20   ;  Graph6Color =  0 ; Graph6Style = 4 ; //Pásmo preprodanosti SSO
Graph7   = 80   ;  Graph7Color =  0 ; Graph7Style = 4 ; //Pásmo prekoupenosti SSO
//________ PÁSY ____________________________________________________________________
Graph50 = -10 ; Graph50Style = 4+2 ; Graph50BarColor = IIf(B,5,IIf(S,4,1));
Graph51 = -20 ; Graph51Style = 4+2 ; Graph51BarColor = IIf(BP,5,IIf(SP,4,2));
Graph52 = -30 ; Graph52Style = 4+2 ; Graph52BarColor = IIf(BP2,5,IIf(SP2,4,2));
Graph53 = -40 ; Graph53Style = 4+2 ; Graph53BarColor = UTM;
//________ Rozdìlení pásù __________________________________________________________
Graph10 =   0 ; Graph10Style = 4;    Graph10Color = 1;  //Rozdelení pásu
Graph11 = -10 ; Graph11Style = 4;    Graph11Color = 1;  //Rozdelení pásu
Graph12 = -20 ; Graph12Style = 4;    Graph12Color = 1;  //Rozdelení pásu
Graph13 = -30 ; Graph13Style = 4;    Graph13Color = 1;  //Rozdelení pásu
Graph14 = -40 ; Graph14Style = 4;    Graph14Color = 1;  //Rozdelení pásu
//________ Probarvení pásu _________________________________________________________
Graph150 =  -1 ;Graph150Style = 4 ; Graph150color=1;
Graph151 =  -2 ;Graph151Style = 4 ; Graph151color=1;
Graph152 =  -3 ;Graph152Style = 4 ; Graph152color=1;
Graph153 =  -4 ;Graph153Style = 4 ; Graph153color=1;
Graph154 =  -5 ;Graph154Style = 4 ; Graph154color=1;
Graph155 =  -6 ;Graph155Style = 4 ; Graph155color=1;
Graph156 =  -7 ;Graph156Style = 4 ; Graph156color=1;
Graph157 =  -8 ;Graph157Style = 4 ; Graph157color=1;
Graph158 =  -9 ;Graph158Style = 4 ; Graph158Color=1;

Graph160 =  -30 ;Graph160Style = 4 ; Graph160Barcolor=UTM;
Graph161 =  -31 ;Graph161Style = 4 ; Graph161Barcolor=UTM;
Graph162 =  -32 ;Graph162Style = 4 ; Graph162Barcolor=UTM;
Graph163 =  -33 ;Graph163Style = 4 ; Graph163Barcolor=UTM;
Graph164 =  -34 ;Graph164Style = 4 ; Graph164Barcolor=UTM;
Graph165 =  -35 ;Graph165Style = 4 ; Graph165Barcolor=UTM;
Graph166 =  -36 ;Graph166Style = 4 ; Graph166Barcolor=UTM;
Graph167 =  -37 ;Graph167Style = 4 ; Graph167Barcolor=UTM;
Graph168 =  -38 ;Graph168Style = 4 ; Graph168BarColor=UTM;
Graph169 =  -39 ;Graph169Style = 4 ; Graph169BarColor=UTM;
//XXXXXXXXXXXXXXXXXXX TEXT XXXXXXXXXXXXXXXXXXXXXXXXXXXXXXXXXXXXXXXXXXXXXXXXXXXXXXXX
Title=" COMBO - GRAFY:1=RSI("+WriteVal(TI,format=1.0)+","+WriteVal(TS,format=1.0)+")"
+"   2=SSO("+WriteVal(D3,format=1.0)+")"
+"   PÁSY: 1=RSI+SSO  2=RSI  3=SSO  4=Trend MA(C,"+WriteVal(F1,format=1.0)+"/"+WriteVal(F2,format=1.0)+") ";
//XXXXXXXXXXXXXXXXXXX EXPLORE XXXXXXXXXXXXXXXXXXXXXXXXXXXXXXXXXXXXXXXXXXXXXXXXXXXXXX
Filter= BP;
NumColumns=3;
TB  = C > MA(C,20);

Column0 = BP  ; Column0Name = "SIGNÁL RSI"      ; Column0Format = 1.0 ;
Column1 = TB  ; Column1Name = "TREND BULL"  ; Column1Format = 1.0 ;
Column2 = C   ; Column2Name = "CLOSE"       ; Column2Format = 1.2 ;
2 comments
Leave Comment
Please login here to leave a comment.
good
Dear admin
How to set up exploration or scan when all 4 lines turn red or green at the same time? please advise