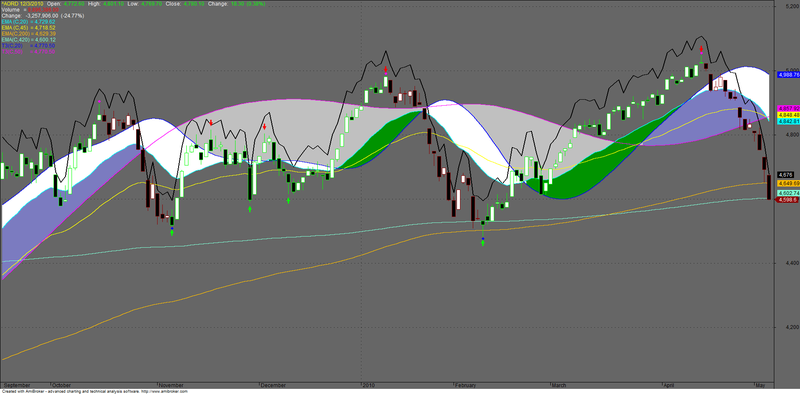
T3 buy/sell update for Amibroker (AFL)
bigyorum.com almost 15 years ago Amibroker (AFL)
T3 buy/sell update
Screenshots
Indicator / Formula
Copy & Paste Friendly
_SECTION_BEGIN("T3 Function");

SetChartOptions(0,chartShowArrows|chartShowDates);
SetChartBkColor(31) ;


function T3(price,periods)


{
s = 0.84;
e1=EMA(price,periods);
e2=EMA(e1,Periods);
e3=EMA(e2,Periods);
e4=EMA(e3,Periods);
e5=EMA(e4,Periods);
e6=EMA(e5,Periods);
c1=-s*s*s;
c2=3*s*s+3*s*s*s;
c3=-6*s*s-3*s-3*s*s*s;
c4=1+3*s+s*s*s+3*s*s;
Ti3=c1*e6+c2*e5+c3*e4+c4*e3;
return ti3;
}
PercentChange = 4;
ZZ = Zig(C,LastValue(PercentChange)) ;
PivotLow = Ref(IIf(Ref(ROC(ZZ,1),-1) < 0 AND ROC(ZZ,1) > 0, 1, Null),1);
PivotHigh = Ref(IIf(Ref(ROC(ZZ,1),-1) > 0 AND ROC(ZZ,1) < 0, 1, Null),1);
Buy_Valid = IIf(C>(.01+(LastValue(PercentChange)/100))*(ValueWhen(PivotLow, C, 1))
AND ROC(ZZ,1) > 0,1,0);

Color=IIf(Buy_Valid OR PivotLow,5,IIf(NOT Buy_Valid,colorDarkRed,colorBlue));
Plot (C,"Close",color,64,32);
//Plot(C,"",4,64);
Plot(T3(C,50),"T3",colorCustom12,4);
Plot(t3(C,20),"T3",colorBlue,4);
X1=Ref(C,-1);
X1=Ref(C,-2);

//Buy=H<T3(C,50) AND H<t3(C,20) AND C>X1 ;
_SECTION_END();

Plot (EMA (C,20), "EMA 20",colorCustom11,4);
Plot (EMA (C,45), "EMA 45",colorYellow,4);
Plot (EMA (C,200), "EMA 200",9,4);//colorAqua
Plot (EMA (C,420), "EMA 200",colorAqua,4);//
Plot(TEMA(C+(C/60),2),"C*2",colorBlack,4);
_SECTION_BEGIN("MA");
P = ParamField("Price field",-1);
Periods = Param("Periods", 10, 2, 200, 1 );//colorOrange
//Plot( MA( P, Periods ), _DEFAULT_NAME(),colorOrange, 4);
_SECTION_END();

_SECTION_BEGIN("WMA1");
P = ParamField("Price field",-1);
Periods = Param("Periods",8, 1, 300, 1, 5 );
//Plot( WMA( P, 5 ), "WMA(5)", colorBrightGreen, ParamStyle("Style") );
_SECTION_END();


_SECTION_BEGIN("Colud10");

Color = IIf(EMA (C,20) < t3(C,20) , colorWhite,//LightGrey//30
         IIf(EMA (C,20) > t3(C,20),colorGreen,7 ) );//PaleGreen,colorPink
Colori = IIf(T3(C,50) < t3(C,20) , 30,
         IIf(T3(C,50) > t3(C,20), colorLightGrey,7 ) );
PlotOHLC(EMA (C,20), EMA (C,20), t3(C,20) , t3(C,20) , "", Color, styleCloud | styleNoLabel);
PlotOHLC(t3(C,50), t3(C,50), t3(C,20) , t3(C,20) , "", Colori, styleCloud | styleNoLabel);

_SECTION_END();

_SECTION_BEGIN("Cloud10");
Color = IIf(EMA (C,20) < t3(C,20) , colorWhite,//LightGrey//30
         IIf(EMA (C,20) > t3(C,20),12 ,7 ) );//PaleGreen,colorPink
Colori = IIf(T3(C,50) < t3(C,20) , colorGreen,
         IIf(T3(C,50) > t3(C,20), colorLightGrey,7 ) );
PlotOHLC(EMA (C,20), EMA (C,20), t3(C,20) , t3(C,20) , "", Color, styleCloud | styleNoLabel);
PlotOHLC(t3(C,50), t3(C,50), t3(C,20) , t3(C,20) , "", Colori, styleCloud | styleNoLabel);

//Buy=H>EMA (C,20) AND Ref(H,-1)<EMA (C,20)AND Ref(H,-2)<EMA (C,20);


_SECTION_BEGIN("Zig Zag Indicator with Valid Entry and Exit Points");
//------------------------------------------------------------------------------
//
//  Formula Name:    Zig Zag Indicator with Valid Entry and Exit Points
PercentChange = 6;
ZZ = Zig(C,LastValue(PercentChange)) ;
PivotLow = Ref(IIf(Ref(ROC(ZZ,1),-1) < 0 AND ROC(ZZ,1) > 0, 1, Null),1);
PivotHigh = Ref(IIf(Ref(ROC(ZZ,1),-1) > 0 AND ROC(ZZ,1) < 0, 1, Null),1);
PlotShapes ( IIf(PivotHigh, shapeSmallCircle, shapeNone), colorCustom12,0,H, 5);
PlotShapes( IIf(PivotLow, shapeSmallCircle, shapeNone),  colorBlue,0, L, -5);

_SECTION_END();

_SECTION_BEGIN("GIP-3");
// -- what will be our lookback range for the hh and ll?
nBars = Param("Number of bars", 12, 5, 40);
bTrace = Param("Include trace output", 1, 0, 1);
nNoPivsInSetup = Param("No. Pivs in Setup", 4, 3, 4, 1);
bShowTCZ = Param("Show TCZ", 1, 0, 1);
nMinBarsBtwPivs = Param("Min. number of bars btw. pivots", 1, 1, 10, 1);
nMinPctBtwPivs = Param("Min. percent diff. btw. pivots", .05, .04, .2, .01);
bLastBarCanBePiv = Param("Last bar can be a pivot", 1, 0, 1);
retrcTolerance = .01;
tczTolerance = .005;
nNumBarsToScan = 120;

// -- added from exploration version 20040204
nExploreBarIdx = 0;
nExploreDate = 0;
nCurDateNum = 0;
DN = DateNum();
DT = DateTime();

// -- key exploration variables
bTCZLong = False;
bTCZShort = False;
nAnchorPivIdx = 0;

ADX8 = ADX(8);

// 1 - INDICATOR, 2 - COMMENTARY, 3 - SCAN,
// 4 - EXPLORATION, 5 - BACKTEST / Optimize
if(Status("action")==1) {
    bDraw = True;
    bUseLastVis = Param("Use last visible bar", 1, 0, 1);
} else {
    bDraw = False;
    bUseLastVis = False;
    bTrace = False;
    nExploreDate = Status("rangetodate");
    for (i=LastValue(BarIndex());i>=0;i--) {
        nCurDateNum = DN[i];
        if (nCurDateNum == nExploreDate) {
            nExploreBarIdx = i;
        }
    }
// -- if(Status("action")==1...
}

GraphXSpace=7;

// -- Create 0-initialized arrays the size of barcount
aHPivs = H - H;
aLPivs = L - L;
aHPivHighs = H - H;
aLPivLows = L - L;
aHPivIdxs = H - H;
aLPivIdxs = L - L;
aAddedHPivs = H - H;
aAddedLPivs = L - L;
aLegVol = H - H;
aRetrcVol = H - H;

nHPivs = 0;
nLPivs = 0;

lastHPIdx = 0;
lastLPIdx = 0;
lastHPH = 0;
lastLPL = 0;
curPivBarIdx = 0;

// -- looking back from the current bar, how many bars
//    back were the hhv and llv values of the previous
//    n bars, etc.?
aHHVBars = HHVBars(H, nBars);
aLLVBars = LLVBars(L, nBars);
aHHV = HHV(H, nBars);
aLLV = LLV(L, nBars);

// -- Initialize value of curTrend
nLastVisBar = LastValue(
    Highest(IIf(Status("barvisible"), BarIndex(), 0)));

curBar = IIf(nlastVisBar > 0 AND bUseLastVis, nlastVisBar,
    IIf(Status("action")==4 AND nExploreBarIdx > 0, nExploreBarIdx,
    LastValue(BarIndex())));

curTrend = "";
if (aLLVBars[curBar] < aHHVBars[curBar])
    curTrend = "D";
else
    curTrend = "U";

// -- Make sure there are enough bars!
if (curBar >= nNumBarsToScan) {
    for (i=0; i<nNumBarsToScan; i++) {

        // -- value of curBar dependent on two parameters
        curBar = IIf(nlastVisBar > 0 AND bUseLastVis,
            nlastVisBar-i,
            IIf(Status("action")==4 AND nExploreBarIdx > 0,
            nExploreBarIdx-i,
            LastValue(BarIndex())-i));

        // -- Have we identified a pivot? If trend is down...
        if (aLLVBars[curBar] < aHHVBars[curBar]) {

            // ... and had been up, this is a trend change
            if (curTrend == "U") {
                curTrend = "D";
                // -- Capture pivot information
                curPivBarIdx = curBar - aLLVBars[curBar];
                aLPivs[curPivBarIdx] = 1;
                aLPivLows[nLPivs] = L[curPivBarIdx];
                aLPivIdxs[nLPivs] = curPivBarIdx;
                nLPivs++;
            }
        // -- or current trend is up
        } else {
            if (curTrend == "D") {
                curTrend = "U";
                curPivBarIdx = curBar - aHHVBars[curBar];
                aHPivs[curPivBarIdx] = 1;
                aHPivHighs[nHPivs] = H[curPivBarIdx];
                aHPivIdxs[nHPivs] = curPivBarIdx;
                nHPivs++;
            }
        // --   If curTrend is up...else...
        }

    // -- loop through bars
    }
}


// -- Start at last bar. Reestablish curBar
curBar =
    IIf(nlastVisBar > 0 AND bUseLastVis,
    nlastVisBar,
    IIf(Status("action")==4 AND nExploreBarIdx > 0,
    nExploreBarIdx,
    LastValue(BarIndex()))
    );

// -- Make sure I found at least two of each above.
if (nHPivs >= 2 AND nLPivs >= 2) {

    lastLPIdx = aLPivIdxs[0];
    lastLPL = aLPivLows[0];

    lastHPIdx = aHPivIdxs[0];
    lastHPH = aHPivHighs[0];

    nLastHOrLPivIdx = Max(lastLPIdx, lastHPIdx);

    nAddPivsRng = curBar - nLastHOrLPivIdx;
    aLLVAfterLastPiv = LLV(L, nAddPivsRng);
    nLLVAfterLastPiv = aLLVAfterLastPiv[curBar];
    aLLVIdxAfterLastPiv = LLVBars(L, nAddPivsRng);
    nLLVIdxAfterLastPiv = curBar - aLLVIdxAfterLastPiv[curBar];
    aHHVAfterLastPiv = HHV(H, nAddPivsRng);
    nHHVAfterLastPiv = aHHVAfterLastPiv[curBar];
    aHHVIdxAfterLastPiv = HHVBars(H, nAddPivsRng);
    nHHVIdxAfterLastPiv = curBar - aHHVIdxAfterLastPiv[curBar];

    // -- Later want to add last high pivot only if

    if (lastHPIdx > lastLPIdx) {


        if (aHPivHighs[0] < aHPivHighs[1]) {

            if (nLLVAfterLastPiv < aLPivLows[0] AND
                (nLLVIdxAfterLastPiv - lastHPIdx - 1) >= nMinBarsBtwPivs
                AND nLLVIdxAfterLastPiv != curBar   ) {

                // -- OK, we'll add this as a pivot.
                //    Mark it for plotting...
                aLPivs[nLLVIdxAfterLastPiv] = 1;
                aAddedLPivs[nLLVIdxAfterLastPiv] = 1;

                //    ...and then rearrange elements in the
                //    pivot information arrays
                for (j=0; j<nLPivs; j++) {
                    aLPivLows[nLPivs-j] = aLPivLows[nLPivs-(j+1)];
                    aLPivIdxs[nLPivs-j] = aLPivIdxs[nLPivs-(j+1)];
                }
                aLPivLows[0] = nLLVAfterLastPiv;
                aLPivIdxs[0] = nLLVIdxAfterLastPiv;
                nLPivs++;

            // -- Test whether to add piv given last piv is high
            //    AND we have lower highs
            }

        // -- Here, the last piv is a high piv, and we have
        //    higher-highs. The most likely addition is a
        //    Low piv that is a retracement.
        } else {

            if (nLLVAfterLastPiv > aLPivLows[0] AND
                (nLLVIdxAfterLastPiv - lastHPIdx - 1) >= nMinBarsBtwPivs
                AND nLLVIdxAfterLastPiv != curBar   ) {

                // -- OK, we'll add this as a pivot.
                //    Mark it for plotting...
                aLPivs[nLLVIdxAfterLastPiv] = 1;
                aAddedLPivs[nLLVIdxAfterLastPiv] = 1;

                //    ...and then rearrange elements in the
                //    pivot information arrays
                for (j=0; j<nLPivs; j++) {
                    aLPivLows[nLPivs-j] = aLPivLows[nLPivs-(j+1)];
                    aLPivIdxs[nLPivs-j] = aLPivIdxs[nLPivs-(j+1)];
                }
                aLPivLows[0] = nLLVAfterLastPiv;
                aLPivIdxs[0] = nLLVIdxAfterLastPiv;
                nLPivs++;

            // -- Test whether to add piv given last piv is high
            //    AND we have lower highs
            }
        // -- The last piv is a high and we have higher highs
        //    OR lower highs
        }

    /* ****************************************************************
        Still finding missed pivot(s). Here, the last piv is a low piv.
    **************************************************************** */
    } else {

        // -- First case, lower highs
        if (aHPivHighs[0] < aHPivHighs[1]) {

            if (nHHVAfterLastPiv < aHPivHighs[0] AND
                (nHHVIdxAfterLastPiv - lastLPIdx - 1) >= nMinBarsBtwPivs
                AND nHHVIdxAfterLastPiv != curBar   ) {

                // -- OK, we'll add this as a pivot.
                //    Mark that for plotting
                aHPivs[nHHVIdxAfterLastPiv] = 1;
                aAddedHPivs[nHHVIdxAfterLastPiv] = 1;

                //    ...and then rearrange elements in the
                //    pivot information arrays
                for (j=0; j<nHPivs; j++) {
                    aHPivHighs[nHPivs-j] = aHPivHighs[nHPivs-(j+1)];
                    aHPivIdxs[nHPivs-j] = aHPivIdxs[nhPivs-(j+1)];
                }
                aHPivHighs[0] = nHHVAfterLastPiv;
                aHPivIdxs[0] = nHHVIdxAfterLastPiv;
                nHPivs++;

            // -- Test whether to add piv given last piv is high
            //    AND we have lower highs
            }

        // -- Second case when last piv is a low piv, higher highs
        //    Most likely addition is high piv that is a retracement.
        //    Considering adding a high piv as long as it is higher
        } else {

            // -- Where I have higher highs,
            if (nHHVAfterLastPiv > aHPivHighs[0] AND
                (nHHVIdxAfterLastPiv - lastLPIdx - 1) >= nMinBarsBtwPivs
                AND nHHVIdxAfterLastPiv != curBar   ) {

                // -- OK, we'll add this as a pivot.
                //    Mark it for plotting...
                aHPivs[nHHVIdxAfterLastPiv] = 1;
                aAddedHPivs[nHHVIdxAfterLastPiv] = 1;

                //    ...and then rearrange elements in the
                //    pivot information arrays
                for (j=0; j<nHPivs; j++) {
                    aHPivHighs[nHPivs-j] = aHPivHighs[nHPivs-(j+1)];
                    aHPivIdxs[nHPivs-j] = aHPivIdxs[nhPivs-(j+1)];
                }
                aHPivHighs[0] = nHHVAfterLastPiv;
                aHPivIdxs[0] = nHHVIdxAfterLastPiv;
                nHPivs++;

            // -- Test whether to add piv given last piv is high
            //    AND we have lower highs
            }

        }

    }

// -- If there are at least two of each
}

/* ****************************************
// -- Done with finding pivots
***************************************** */

if (bDraw) {

    // -- OK, let's plot the pivots using arrows
    PlotShapes(
        IIf(aHPivs==1, shapeDownArrow, shapeNone),
            colorRed, 0,    High, Offset=-15);
    PlotShapes(
        IIf(aAddedHPivs==1, shapeDownArrow, shapeNone),
            colorCustom12, 0, High, Offset=-15);
    PlotShapes(
        IIf(aLPivs==1, shapeUpArrow , shapeNone),
            5, 0, Low, Offset=-15);
    PlotShapes(
        IIf(aAddedLPivs==1, shapeUpArrow , shapeNone),
            colorBlue, 0, Low, Offset=-15);
}

Buy =  aLPivs OR aAddedLPivs;
Sell = aHPivs OR aAddedHPivs;


 Title = EncodeColor(colorYellow)+Title =Name() + " " + Date() +EncodeColor( colorYellow) +
   EncodeColor(55)+ "   Open:  "+ WriteIf(O> Ref(O,-1),EncodeColor(colorBrightGreen),EncodeColor(colorRed))+ WriteVal(O,format=1.2) +
    EncodeColor(55)+ "   High:  "+ WriteIf(H> Ref(H,-1),EncodeColor(colorBrightGreen),EncodeColor(colorRed))+  WriteVal(H,format=1.2) +
    EncodeColor(55)+ "   Low:  "+ WriteIf(L> Ref(L,-1),EncodeColor(colorBrightGreen),EncodeColor(colorRed))+  WriteVal(L,format=1.2) +
    EncodeColor(55)+ "   Close:  "+ WriteIf(C> Ref(C,-1),EncodeColor(colorBrightGreen),EncodeColor(colorRed))+ WriteVal(C,format=1.2)+
      EncodeColor(55)+ "   Change:  "+WriteIf(C> Ref(C,-1),EncodeColor(5),EncodeColor(55))+ WriteVal((C-Ref(C,-1)),format=1.2)+  "  ("+ WriteVal(ROC(C,1),format=1.2)+ "%"+ ")  "+
   "\n"+EncodeColor(55)+"Volume   = "+ WriteIf(V> Ref(V,-1),EncodeColor(colorBrightGreen),EncodeColor(colorRed))+ WriteVal(V,format=1.2)+
   "\n"+EncodeColor(55)+"Change:   "+WriteIf(V> Ref(V,-1),EncodeColor(5),EncodeColor(55))+ WriteVal((V-Ref(V,-1)),format=1.2)+  "  ("+ WriteVal(ROC(V,1),format=1.2)+ "%"+ ")  "+
   "\n"+EncodeColor(colorCustom11)+"EMA (C,20)  = "+ WriteVal(EMA (C,20),format=1.2)+
   "\n"+EncodeColor(colorYellow)+"EMA (C,45)  = "+ WriteVal(EMA (C,45),format=1.2)+
   "\n"+EncodeColor(9)+"EMA(C,200) = "+ WriteVal(EMA (C,200),format=1.2)+
   "\n"+EncodeColor(colorAqua)+"EMA(C,420) = "+ WriteVal(EMA (C,420),format=1.2)+
   "\n"+EncodeColor(colorBlue)+"T3(C,20)      = "+ WriteVal(t3(C,20),format=1.2)+
   "\n"+EncodeColor(colorCustom12)+"T3(C,50)      = "+ WriteVal(t3(C,20),format=1.2);


_SECTION_END();
4 comments
Leave Comment
Please login here to leave a comment.
signals refer to future quotes.Another bogus afl.
100% bogus afl indeed. I request the admin to avoid publishing these kind of afls referring into future. Its of no use to anybody. Infact i have seen many innocent traders losing their fortune following similar afls where the signal arrows appear and vanish depending on future quotes.
I don’t think there is a 100% sure win system in this world. If people follow a system blindly without using their own judgement at all, they should NOT even use a system.
IMHO, whenever there is a arrow appear, ask yourself this: is this arrow going to disappear in a few days? Use your own judgement. If you think the arrow is not a strong signal, don’t follow it.
This is a good “heads up” system for those who are into technical analysis. For those who don’t want to spend time to study their own strategy and believe there is something magically help them earn money even in their sleep, this is poison though. You will be your own judge.
Great system to solve the future reference problem use following code
Buy = IIf(Ref(aLPivs,-1) OR Ref(aAddedLPivs,-1),1,0);
Sell = IIf(Ref(aHPivs,-1) OR Ref(aAddedHPivs,-1),1,0);
Thanks a lot to the author great effort.
Shirish