POLYNOMIAL for Amibroker (AFL)
elliot over 14 years ago Amibroker (AFL)
POLYNOMIALS
Use the parameters to enable and disable certain options.
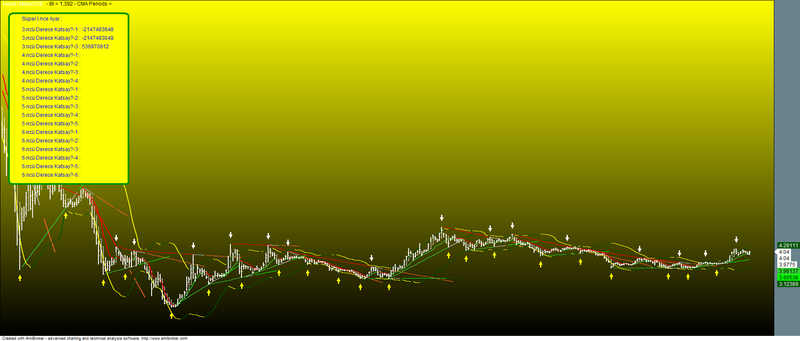
Screenshots
Indicator / Formula
Copy & Paste Friendly
_SECTION_BEGIN( "Chart Settings" );
SetChartOptions( 0, chartShowArrows | chartShowDates );
SetChartBkColor( ParamColor( "Outer Panel", colorPaleBlue ) );
SetChartBkGradientFill( ParamColor( "Upper Chart", colorBlack ), ParamColor( "Lower Chart", colorBlack ) );
_SECTION_END();
_SECTION_BEGIN( "Katsay? Optimizeli 6.nc? Dereceden Polynom'un WMA()'s? Al?nm?s, Deklem" );
PG = ParamToggle( " Polynom Göstermek ", "hide|show", 0 );
ACID = Param( "Süper I.nce Ayar", 1, 1, 180, 0.001 );
Derece3 = ParamToggle( "3.ncü Derece Polynom ", "hide|show", 0 );
Derece4 = ParamToggle( "4.ncü Derece Polynom ", "hide|show", 0 );
Derece5 = ParamToggle( "5.ncü Derece Polynom ", "hide|show", 0 );
Derece6 = ParamToggle( "6.ncü Derece Polynom ", "hide|show", 0 );
Shape = ParamToggle( " Oklar? Göstermek ", "hide|show", 0 );
Katsayi43 = ( Param( "3.Katsay?1", 0, -2, 30, 0.001 ) );
Katsayi53 = Param( "3.Katsay?2", 0, -2, 30, 0.001 );
Katsayi63 = Param( "3.Katsay?3", 0, -2, 30, 0.001 );
Katsayi34 = Param( "4.Katsay?1", 0, -30, 30, 0.001 );
Katsayi44 = Param( "4.Katsay?2", 0, -30, 30, 0.001 );
Katsayi54 = Param( "4.Katsay?3", 0, -30, 30, 0.001 );
Katsayi64 = Param( "4.Katsay?4", 0, -30, 30, 0.001 );
Katsayi25 = Param( "5.Katsay?1", 0, -30, 30, 0.001 );
Katsayi35 = Param( "5.Katsay?2", 0, -30, 30, 0.001 );
Katsayi45 = Param( "5.Katsay?3", 0, -30, 30, 0.001 );
Katsayi55 = Param( "5.Katsay?4", 0, -30, 30, 0.001 );
Katsayi65 = Param( "5.Katsay?5", 0, -30, 30, 0.001 );
Katsayi16 = Param( "6.Katsay?1", 0, -30, 30, 0.001 );
Katsayi26 = Param( "6.Katsay?2", 0, -30, 30, 0.001 );
Katsayi36 = Param( "6.Katsay?3", 0, -30, 30, 0.001 );
Katsayi46 = Param( "6.Katsay?4", 0, -30, 30, 0.001 );
Katsayi56 = Param( "6.Katsay?5", 0, -30, 30, 0.001 );
Katsayi66 = Param( "6.Katsay?6", 0, -30, 30, 0.001 );
Moveto = Param( "Sag(a Sola Kayd?r", 1, 1, 1456, 2 );
Moveto1 = Param( "Yukar? As,ag(? Kayd?r", 1, 1, 1456, 2 );
if( PG )
{
GfxSelectPen( colorGreen, 4 );
GfxSelectSolidBrush( colorYellow );
GfxRoundRect( 20 + Moveto, 30 + Moveto1, 300 + Moveto, 430 + Moveto1, 15, 15 );
GfxSelectPen( colorRed );
GfxSetTextColor( colorBlue );
GfxSetTextAlign( 0 );
GfxSetBkColor( colorYellow );
GfxTextOut( "Süper I.nce Ayar : " + StrFormat( "%-3.000d", ACID ), 50 + Moveto, 35 + Moveto1 );
PlotOHLC( O, H, L, C, "Data", colorWhite, styleBar | styleThick );
pi = 22 / 7;
Rtd = 180 / Pi;
Dtr = 1 / Rtd;
x = ( O + C + H + L ) / 4;
if( Derece3 )
{
Katsayi43 = Katsayi43 * ( ACID * DTR );
Katsayi53 = Katsayi53 * ( ACID * DTR );
Katsayi63 = Katsayi63 * ( ACID * DTR );
y3 = Katsayi43 * x * exp( 3 ) + Katsayi53 * x * exp( 2 ) + Katsayi63 * x;
y3m = WMA( x, y3 );
for( i = 1 ; i < BarCount - 2; i++ )
{
if( y3m[i] < y3m[i - 1] && y3m[i] < y3m[i + 1] ) Lpml[i] = 1;
else
Lpml[i] = 0;
if( y3m[i] > y3m[i - 1] && y3m[i] > y3m[i + 1] ) Lpmh[i] = 1;
else
Lpmh[i] = 0;
}
GR = ExRem( LpmH, Lpmh );
RD = ExRem( Lpml, Lpml );
if( Shape )
{
PlotShapes( IIf( GR != 0, shapeDownArrow, shapeNone ), colorRed, H, y3m, -30 );
PlotShapes( IIf( RD != 0, shapeUpArrow, shapeNone ), colorBrightGreen, L, y3m, -30 );
}
Plot( y3m, "", IIf( y3m > Ref( y3m, -1 ), colorLime, colorRed ), styleLine | styleThick );
GfxTextOut( "3.ncü Derece Katsay?-1 : " + StrFormat( "%-3.000d", Katsayi43 ), 50 + Moveto, 60 + Moveto1 );
GfxTextOut( "3.ncü Derece Katsay?-2 : " + StrFormat( "%-3.000d", Katsayi53 ), 50 + Moveto, 80 + Moveto1 );
GfxTextOut( "3.ncü Derece Katsay?-3 : " + StrFormat( "%-3.000d", Katsayi63 ), 50 + Moveto, 100 + Moveto1 );
}
if( Derece4 )
{
Katsayi34 = Katsayi34 * ( ACID * DTR );
Katsayi44 = Katsayi44 * ( ACID * DTR );
Katsayi54 = Katsayi54 * ( ACID * DTR );
Katsayi64 = Katsayi64 * ( ACID * DTR );
y4 = Katsayi34 * x * exp( 4 ) + Katsayi44 * x * exp( 3 ) + Katsayi54 * x * exp( 2 ) + Katsayi64 * x;
y4m = WMA( x, y4 );
for( i = 1 ; i < BarCount - 2; i++ )
{
if( y4m[i] < y4m[i - 1] && y4m[i] < y4m[i + 1] ) Lpml[i] = 1;
else
Lpml[i] = 0;
if( y4m[i] > y4m[i - 1] && y4m[i] > y4m[i + 1] ) Lpmh[i] = 1;
else
Lpmh[i] = 0;
}
GR = ExRem( LpmH, Lpmh );
RD = ExRem( Lpml, Lpml );
if( Shape )
{
PlotShapes( IIf( GR != 0, shapeDownArrow, shapeNone ), colorRed, H, y4m, -40 );
PlotShapes( IIf( RD != 0, shapeUpArrow, shapeNone ), colorBrightGreen, L, y4m, -40 );
}
Plot( y4m, "", IIf( y4m > Ref( y4m, -1 ), colorLime, colorRed ), styleLine | styleThick );
GfxTextOut( "4.ncü Derece Katsay?-1 : " + StrFormat( "%-3.000d", Katsayi34 ), 50 + Moveto, 120 + Moveto1 );
GfxTextOut( "4.ncü Derece Katsay?-2 : " + StrFormat( "%-3.000d", Katsayi44 ), 50 + Moveto, 140 + Moveto1 );
GfxTextOut( "4.ncü Derece Katsay?-3 : " + StrFormat( "%-3.000d", Katsayi54 ), 50 + Moveto, 160 + Moveto1 );
GfxTextOut( "4.ncü Derece Katsay?-4 : " + StrFormat( "%-3.000d", Katsayi64 ), 50 + Moveto, 180 + Moveto1 );
}
if( Derece5 )
{
Katsayi25 = Katsayi25 * ( ACID * DTR );
Katsayi35 = Katsayi35 * ( ACID * DTR );
Katsayi45 = Katsayi45 * ( ACID * DTR );
Katsayi55 = Katsayi55 * ( ACID * DTR );
Katsayi65 = Katsayi65 * ( ACID * DTR );
y5 = Katsayi25 * x * exp( 5 ) + Katsayi35 * x * exp( 4 ) + Katsayi45 * x * exp( 3 ) + Katsayi55 * x * exp( 2 ) + Katsayi65 * x;
y5m = WMA( x, y5 );
for( i = 1 ; i < BarCount - 2; i++ )
{
if( y5m[i] < y5m[i - 1] && y5m[i] < y5m[i + 1] ) Lpml[i] = 1;
else
Lpml[i] = 0;
if( y5m[i] > y5m[i - 1] && y5m[i] > y5m[i + 1] ) Lpmh[i] = 1;
else
Lpmh[i] = 0;
}
GR = ExRem( LpmH, Lpmh );
RD = ExRem( Lpml, Lpml );
if( Shape )
{
PlotShapes( IIf( GR != 0, shapeDownArrow, shapeNone ), colorRed, H, y5m, -50 );
PlotShapes( IIf( RD != 0, shapeUpArrow, shapeNone ), colorBrightGreen, L, y5m, -50 );
}
Plot( y5m, "", IIf( y5m > Ref( y5m, -1 ), colorLime, colorRed ), styleLine | styleThick );
GfxTextOut( "5.ncü Derece Katsay?-1 : " + StrFormat( "%-3.000d", Katsayi25 ), 50 + Moveto, 200 + Moveto1 );
GfxTextOut( "5.ncü Derece Katsay?-2 : " + StrFormat( "%-3.000d", Katsayi35 ), 50 + Moveto, 220 + Moveto1 );
GfxTextOut( "5.ncü Derece Katsay?-3 : " + StrFormat( "%-3.000d", Katsayi45 ), 50 + Moveto, 240 + Moveto1 );
GfxTextOut( "5.ncü Derece Katsay?-4 : " + StrFormat( "%-3.000d", Katsayi55 ), 50 + Moveto, 260 + Moveto1 );
GfxTextOut( "5.ncü Derece Katsay?-5 : " + StrFormat( "%-3.000d", Katsayi65 ), 50 + Moveto, 280 + Moveto1 );
}
if( Derece6 )
{
Katsayi16 = Katsayi16 * ( ACID * DTR );
Katsayi26 = Katsayi26 * ( ACID * DTR );
Katsayi36 = Katsayi36 * ( ACID * DTR );
Katsayi46 = Katsayi46 * ( ACID * DTR );
Katsayi56 = Katsayi56 * ( ACID * DTR );
Katsayi66 = Katsayi66 * ( ACID * DTR );
y6 = Katsayi16 * x * exp( 6 ) + Katsayi26 * x * exp( 5 ) + Katsayi36 * x * exp( 4 ) + Katsayi46 * x * exp( 3 ) + Katsayi56 * x * exp( 2 ) + Katsayi66 * x;
y6m = WMA( x, y6 );
for( i = 1 ; i < BarCount - 2; i++ )
{
if( y6m[i] < y6m[i - 1] && y6m[i] < y6m[i + 1] ) Lpml[i] = 1;
else
Lpml[i] = 0;
if( y6m[i] > y6m[i - 1] && y6m[i] > y6m[i + 1] ) Lpmh[i] = 1;
else
Lpmh[i] = 0;
}
GR = ExRem( LpmH, Lpmh );
RD = ExRem( Lpml, Lpml );
if( Shape )
{
PlotShapes( IIf( GR != 0, shapeHollowCircle, shapeNone ), colorRed, H, y6m, 0 );
PlotShapes( IIf( RD != 0, shapeHollowCircle, shapeNone ), colorBrightGreen, L, y6m, 0 );
}
Plot( y6m, "", IIf( y6m > Ref( y6m, -1 ), colorYellow, colorRed ), styleLine | styleThick );
GfxTextOut( "6.ncü Derece Katsay?-1 : " + StrFormat( "%-3.000d", Katsayi16 ), 50 + Moveto, 300 + Moveto1 );
GfxTextOut( "6.ncü Derece Katsay?-2 : " + StrFormat( "%-3.000d", Katsayi26 ), 50 + Moveto, 320 + Moveto1 );
GfxTextOut( "6.ncü Derece Katsay?-3 : " + StrFormat( "%-3.000d", Katsayi36 ), 50 + Moveto, 340 + Moveto1 );
GfxTextOut( "6.ncü Derece Katsay?-4 : " + StrFormat( "%-3.000d", Katsayi46 ), 50 + Moveto, 360 + Moveto1 );
GfxTextOut( "6.ncü Derece Katsay?-5 : " + StrFormat( "%-3.000d", Katsayi56 ), 50 + Moveto, 380 + Moveto1 );
GfxTextOut( "6.ncü Derece Katsay?-6 : " + StrFormat( "%-3.000d", Katsayi66 ), 50 + Moveto, 400 + Moveto1 );
}
}
_SECTION_END();
_SECTION_BEGIN( "Colored Bollinger Bands" );
Bg = ParamToggle( " Bollinger göster ", "hide|show", 0 );
pr = Param( "Period", 20, 0, 100, 1 );
P = ParamField( "Price field", -1 );
Style = ParamStyle( "Style" ) | styleNoRescale | styleNoLabel | styleDashed;
if( Bg )
{
BBT = BBandTop( P, pr, 2 );
BBB = BBandBot( P, pr, 2 );
topcond = ( Cross( BBT, C )OR C > BBT )AND Ref( C, -1 ) > BBT;
botcond = ( Cross( C, BBB ) )AND Ref( C, -1 < BBB );
bbtcolor = IIf( BBT > Ref( BBT, -1 ), colorDarkGreen, colorYellow );
bbbcolor = IIf( BBB > Ref( BBB, -1 ), colorDarkGreen, colorYellow );
PlotOHLC( O, H, L, C, "Data", colorWhite, styleBar | styleThick );
Plot( BBT, "BBTop" + _PARAM_VALUES(), bbtcolor, styleLine | styleThick );
Plot( BBB, "BBBot" + _PARAM_VALUES(), bbbcolor, styleLine | styleThick );
Buy = botcond;
Sell = topcond ;
}
_SECTION_END();
_SECTION_BEGIN( "Hurst Cycle" );
EnableScript("VBScript");
<%
function Gaussian_Elimination (GE_Order, GE_N, GE_SumXn, GE_SumYXn)
Dim b(10, 10)
Dim w(10)
Dim Coeff(10)
for i = 1 To 10
Coeff(i) = 0
next
n = GE_Order + 1
for i = 1 to n
for j = 1 to n
if i = 1 AND j = 1 then
b(i, j) = cDBL(GE_N)
else
b(i, j) = cDbl(GE_SumXn(i + j - 2))
end if
next
w(i) = cDbl(GE_SumYXn(i))
next
n1 = n - 1
for i = 1 to n1
big = cDbl(abs(b(i, i)))
q = i
i1 = i + 1
for j = i1 to n
ab = cDbl(abs(b(j, i)))
if (ab >= big) then
big = ab
q = j
end if
next
if (big <> 0.0) then
if (q <> i) then
for j = 1 to n
Temp = cDbl(b(q, j))
b(q, j) = b(i, j)
b(i, j) = Temp
next
Temp = w(i)
w(i) = w(q)
w(q) = Temp
end if
end if
for j = i1 to n
t = cDbl(b(j, i) / b(i, i))
for k = i1 to n
b(j, k) = b(j, k) - t * b(i, k)
next
w(j) = w(j) - t * w(i)
next
next
if (b(n, n) <> 0.0) then
Coeff(n) = w(n) / b(n, n)
i = n - 1
while i > 0
SumY = cDbl(0)
i1 = i + 1
for j = i1 to n
SumY = SumY + b(i, j) * Coeff(j)
next
Coeff(i) = (w(i) - SumY) / b(i, i)
i = i - 1
wend
Gaussian_Elimination = Coeff
end if
end function
%>
// *********************************************************
// *
// * AFL Function for nth Order Polynomial Fit
// * Calls Gaussian_Elimination ( VBS )
// *
// * Y = The array to Fit
// * BegBar = Beg Bar in range to fit
// * EndBar = End Bar in range to fit
// * Order = 1 - 8 = Order of Poly Fit (Integer)
// * ExtraB = Number of Bars to Extrapolate (Backward)
// * ExtraF = Number of Bars to Extrapolate (Forward)
// *
// *********************************************************
function PolyFit( GE_Y, GE_BegBar, GE_EndBar, GE_Order, GE_ExtraB, GE_ExtraF )
{
BI = BarIndex();
GE_N = GE_EndBar - GE_BegBar + 1;
GE_XBegin = -( GE_N - 1 ) / 2;
GE_X = IIf( BI < GE_BegBar, 0, IIf( BI > GE_EndBar, 0, ( GE_XBegin + BI - GE_BegBar ) ) );
GE_X_Max = LastValue( Highest( GE_X ) );
GE_X = GE_X / GE_X_Max;
X1 = GE_X;
AddColumn( X1, "X1", 1.9 );
GE_Y = IIf( BI < GE_BegBar, 0, IIf( BI > GE_EndBar, 0, GE_Y ) );
GE_SumXn = Cum( 0 );
GE_SumXn[1] = LastValue( Cum( GE_X ) );
GE_X2 = GE_X * GE_X;
GE_SumXn[2] = LastValue( Cum( GE_X2 ) );
GE_X3 = GE_X * GE_X2;
GE_SumXn[3] = LastValue( Cum( GE_X3 ) );
GE_X4 = GE_X * GE_X3;
GE_SumXn[4] = LastValue( Cum( GE_X4 ) );
GE_X5 = GE_X * GE_X4;
GE_SumXn[5] = LastValue( Cum( GE_X5 ) );
GE_X6 = GE_X * GE_X5;
GE_SumXn[6] = LastValue( Cum( GE_X6 ) );
GE_X7 = GE_X * GE_X6;
GE_SumXn[7] = LastValue( Cum( GE_X7 ) );
GE_X8 = GE_X * GE_X7;
GE_SumXn[8] = LastValue( Cum( GE_X8 ) );
GE_X9 = GE_X * GE_X8;
GE_SumXn[9] = LastValue( Cum( GE_X9 ) );
GE_X10 = GE_X * GE_X9;
GE_SumXn[10] = LastValue( Cum( GE_X10 ) );
GE_X11 = GE_X * GE_X10;
GE_SumXn[11] = LastValue( Cum( GE_X11 ) );
GE_X12 = GE_X * GE_X11;
GE_SumXn[12] = LastValue( Cum( GE_X12 ) );
GE_X13 = GE_X * GE_X12;
GE_SumXn[13] = LastValue( Cum( GE_X13 ) );
GE_X14 = GE_X * GE_X13;
GE_SumXn[14] = LastValue( Cum( GE_X14 ) );
GE_X15 = GE_X * GE_X14;
GE_SumXn[15] = LastValue( Cum( GE_X15 ) );
GE_X16 = GE_X * GE_X15;
GE_SumXn[16] = LastValue( Cum( GE_X16 ) );
GE_SumYXn = Cum( 0 );
GE_SumYXn[1] = LastValue( Cum( GE_Y ) );
GE_YX = GE_Y * GE_X;
GE_SumYXn[2] = LastValue( Cum( GE_YX ) );
GE_YX2 = GE_YX * GE_X;
GE_SumYXn[3] = LastValue( Cum( GE_YX2 ) );
GE_YX3 = GE_YX2 * GE_X;
GE_SumYXn[4] = LastValue( Cum( GE_YX3 ) );
GE_YX4 = GE_YX3 * GE_X;
GE_SumYXn[5] = LastValue( Cum( GE_YX4 ) );
GE_YX5 = GE_YX4 * GE_X;
GE_SumYXn[6] = LastValue( Cum( GE_YX5 ) );
GE_YX6 = GE_YX5 * GE_X;
GE_SumYXn[7] = LastValue( Cum( GE_YX6 ) );
GE_YX7 = GE_YX6 * GE_X;
GE_SumYXn[8] = LastValue( Cum( GE_YX7 ) );
GE_YX8 = GE_YX7 * GE_X;
GE_SumYXn[9] = LastValue( Cum( GE_YX8 ) );
GE_Coeff = Cum( 0 );
GE_VBS = GetScriptObject();
GE_Coeff = GE_VBS.Gaussian_Elimination( GE_Order, GE_N, GE_SumXn, GE_SumYXn );
for( i = 1; i <= GE_Order + 1; i++ )
printf( NumToStr( i, 1.0 ) + " = " + NumToStr( GE_Coeff[i], 1.9 ) + "\n" );
GE_X = IIf( BI < GE_BegBar - GE_ExtraB - GE_ExtraF, 0, IIf( BI > GE_EndBar, 0, ( GE_XBegin + BI - GE_BegBar + GE_ExtraF ) / GE_X_Max ) );
GE_X2 = GE_X * GE_X;
GE_X3 = GE_X2 * GE_X;
GE_X4 = GE_X3 * GE_X;
GE_X5 = GE_X4 * GE_X;
GE_X6 = GE_X5 * GE_X;
GE_X7 = GE_X6 * GE_X;
GE_X8 = GE_X7 * GE_X;
GE_X9 = GE_X8 * GE_X;
GE_X10 = GE_X9 * GE_X;
GE_X11 = GE_X10 * GE_X;
GE_X12 = GE_X11 * GE_X;
GE_X13 = GE_X12 * GE_X;
GE_X14 = GE_X13 * GE_X;
GE_X15 = GE_X14 * GE_X;
GE_X16 = GE_X15 * GE_X;
GE_Yn = IIf( BI < GE_BegBar - GE_ExtraB - GE_ExtraF, -1e10, IIf( BI > GE_EndBar, -1e10,
GE_Coeff[1] +
GE_Coeff[2] * GE_X + GE_Coeff[3] * GE_X2 + GE_Coeff[4] * GE_X3 + GE_Coeff[5] * GE_X4 + GE_Coeff[6] * GE_X5 +
GE_Coeff[7] * GE_X6 + GE_Coeff[8] * GE_X7 + GE_Coeff[9] * GE_X8 ) );
return GE_Yn;
}
p1 = Param( "CMA Period 1", 13, 0, 999, 1 );
p2 = Param( "CMA Period 2", 25, 0, 999, 1 );
p3 = Param( "CMA Period 3", 50, 0, 999, 1 );
p4 = Param( "CMA Period 4", 100, 0, 999, 1 );
p5 = Param( "CMA Period 5", 200, 0, 999, 1 );
p6 = Param( "CMA Period 6", 600, 0, 999, 1 );
BType = ParamList( "Band Type", "Percent|Amount" );
Pct1 = Param( "Pct or Amt 1", 1.6, 0, 33, 0.05 );
Pct2 = Param( "Pct or Amt 2", 2.4, 0, 33, 0.05 );
Pct3 = Param( "Pct or Amt 3", 3.6, 0, 33, 0.05 );
Pct4 = Param( "Pct or Amt 4", 5.4, 0, 33, 0.05 );
Pct5 = Param( "Pct or Amt 5", 8.1, 0, 33, 0.05 );
Pct6 = Param( "Pct or Amt 6", 12.0, 0, 33, 0.05 );
ePFac = Param( "Extrapolation Period Factor", 0.35, 0.10, 5.00, 0.05 );
ePOrd = Param( "Extrapolation PolyFit Order", 2, 1, 8, 1 );
eAuto = Param( "Extrapolation Auto Fixup Passes", 5, 0, 9, 1 );
eLFac = Param( "Extrapolation AF Lag Factor", 0.33, 0, 1, 0.01 );
eFFac = Param( "Extrapolation AF Factor", 0.25, 0, 1, 0.01 );
eFLen = Param( "Extrapolation Future Length", 0, 0, 10, 1 );
HT = ParamToggle( "Hurst Cycle Göstermek ", "hide|show", 0 );
BI = BarIndex();
SVBI = SelectedValue( BI );
LVBI = LastValue( BI );
Data = ( H + L ) / 2;
Title = EncodeColor( colorWhite ) + " Hurst / Millard DE " +
EncodeColor( colorDefault ) + " - BI = " + NumToStr( BI, 1.0 ) + " - CMA Periods =
";
GraphXSpace = 5;
function CMA_DE( Period, Percent, Red, Green, Blue )
{
Pm = int( Period * 2 / 3 );
if( Pm % 2 == 0 )
Pm = Pm + 1;
Pn = Period - Pm;
if( Pn < 3 )
Pn = 3;
if( Pm <= Pn )
Pm = Pn + 2;
if( Pn % 2 == 0 )
Pn = Pn + 1;
if( SVBI - ( Pm + Pn ) * ( 1 + eLFac + 0.02 ) > 0 )
{
Lag = ( Pm - 1 ) / 2 + ( Pn - 1 ) / 2;
ExtraF = Lag + eFLen;
CMA = Ref( MA( MA( Data, Pm ), Pn ), Lag );
EndBar = SVBI - Lag;
BegBar = EndBar - round( Period * ePFac ) + 1;
if( EndBar - BegBar < 2 )
BegBar = EndBar - 2;
CMA = IIf( BI <= SVBI - Lag, CMA, -1e10 );
if( BType == "Amount" )
{
UBIS = CMA + Percent;
LBIS = CMA - Percent;
}
else
if( BType == "Percent" )
{
UBIS = CMA * ( 1 + Percent / 100 );
LBIS = CMA * ( 1 - Percent / 100 );
}
Plot( UBIS, "", ColorRGB( Red, Green, Blue ), styleThick );
Plot( LBIS, "", ColorRGB( Red, Green, Blue ), styleThick );
if( Red > 0 ) Red = 254;
if( Green > 0 ) Green = 254;
if( Blue > 0 ) Blue = 254;
CMAx = PolyFit( CMA, BegBar, EndBar, ePOrd, 0, ExtraF );
CMAx = IIf( BI >= SVBI - Lag - ExtraF, CMAx, -1e10 );
if( BType == "Amount" )
{
CMAx = CMAx + CMA[SVBI - Lag] - CMAx[SVBI - Lag - ExtraF];
UBOS = CMAx + Percent;
LBOS = CMAx - Percent;
}
else
{
CMAx = CMAx * CMA[SVBI - Lag] / CMAx[SVBI - Lag - ExtraF];
UBOS = CMAx * ( 1 + Percent / 100 );
LBOS = CMAx * ( 1 - Percent / 100 );
}
k = 0;
for( j = 1; j <= eAuto; j++ )
{
k = j;
AdjBar = 0;
for( i = SVBI - ExtraF; i >= SVBI - ExtraF - Lag * eLFac; i-- )
{
if( i + ExtraF <= LVBI )
{
if( UBOS[i] < ( H[i + ExtraF] + L[i + ExtraF] ) / 2 )
{
AdjBar = i + ExtraF;
Target = CMAx[i] + ( C[i + ExtraF] - CMAx[i] ) * eFFac;
}
if( LBOS[i] > ( H[i + ExtraF] + L[i + ExtraF] ) / 2 )
{
AdjBar = i + ExtraF;
Target = CMAx[i] - ( CMAx[i] - C[i + ExtraF] ) * eFFac;
}
if( AdjBar > 0 )
i = 0;
}
}
if( AdjBar > 0 )
{
ExtraB = AdjBar - EndBar;
ExtraF = ExtraF - ExtraB;
EndBar = EndBar + ExtraB;
StepSize = ( Target - CMA[SVBI - Lag] ) / ( EndBar - ( SVBI -
Lag ) );
CMA = IIf( BI <= SVBI - Lag, CMA, 0 );
for( i = SVBI - Lag + 1; i <= EndBar; i++ )
{
CMA[i] = CMA[i - 1] + StepSize;
}
CMAx = PolyFit( CMA, BegBar, EndBar, ePOrd, 0, ExtraF );
CMAx = IIf( BI >= SVBI - Lag - ExtraF, CMAx, -1e10 );
if( BType == "Amount" )
{
CMAx = CMAx + CMA[SVBI - Lag] - CMAx[SVBI - Lag - ExtraF];
UBOS = CMAx + Percent;
LBOS = CMAx - Percent;
}
else
{
CMAx = CMAx * CMA[SVBI - Lag] / CMAx[SVBI - Lag - ExtraF];
UBOS = CMAx * ( 1 + Percent / 100 );
LBOS = CMAx * ( 1 - Percent / 100 );
}
}
else
j = 999;
}
k = k - 1;
Plot( UBOS, "", ColorRGB( Red, Green, Blue ), styleThick, Null, Null,
ExtraF );
Plot( LBOS, "", ColorRGB( Red, Green, Blue ), styleThick, Null, Null,
ExtraF );
Title = Title + EncodeColor( ColorRGB( Red, Green, Blue ) ) +
NumToStr( Period, 1.0 ) + " (" + NumToStr( Pm, 1.0 ) + "/" + NumToStr( Pn, 1.0 ) + ")
" + NumToStr( k, 1.0 ) + " ";
PlotShapes( ( BI == SVBI - Lag ) * shapeSmallUpTriangle, ColorRGB( Red,
Green, Blue ), 0, CMA * ( 1 - Percent / 100 ), -15 );
PlotShapes( ( BI == SVBI - Lag ) * shapeSmallDownTriangle, ColorRGB( Red,
Green, Blue ), 0, CMA * ( 1 + Percent / 100 ), -15 );
}
return;
}
if( HT )
{
PlotOHLC( O, H, L, C, "Data", colorWhite, styleBar | styleThick );
if( p1 > 0 )
CMA_DE( p1, Pct1, 000, 160, 000 );
if( p2 > 0 )
CMA_DE( p2, Pct2, 160, 112, 000 );
if( p3 > 0 )
CMA_DE( p3, Pct3, 160, 000, 000 );
if( p4 > 0 )
CMA_DE( p4, Pct4, 160, 000, 160 );
if( p5 > 0 )
CMA_DE( p5, Pct5, 000, 000, 160 );
if( p6 > 0 )
CMA_DE( p6, Pct6, 0, 160, 160 );
}
_SECTION_END();
_SECTION_BEGIN( " DESTEK DI.RENÇ" );
DDG = ParamToggle( "Destek Direnç Göstermek ", "hide|show", 0 );
chartflag = ParamToggle( "Heikin Ashi", "show|hide", 1 );
xx = Cum( 1 );
nbar = Param( "nbar", 5, 2, 50, 1 );
if( DDG )
{
PHigh = H > Ref( HHV( H, nbar ), -1 ) AND Ref( HHV( H, nbar ), nbar ) <= H;
PHighPrice = ValueWhen( PHigh, H );
PLow = L < Ref( LLV( L, nbar ), -1 ) AND Ref( LLV( L, nbar ), nbar ) >= L;
PLowPrice = ValueWhen( PLow, L );
startval_L = ValueWhen( PLow, L, 1 );
endval_L = ValueWhen( PLow, L, 0 );
startbar_L = ValueWhen( PLow, xx, 1 );
endbar_L = ValueWhen( PLow, xx, 0 );
aa_L = ( endval_L - startval_L ) / ( endbar_L - startbar_L );
bb_L = startval_L;
trendline_L = aa_L * ( xx - startbar_L ) + bb_L;
dtrendline_L = trendline_L - Ref( trendline_L, -1 );
startval_L_extend = ValueWhen( PLow, L, 2 );
endval_L_extend = ValueWhen( PLow, L, 1 );
startbar_L_extend = ValueWhen( PLow, xx, 2 );
endbar_L_extend = ValueWhen( PLow, xx, 1 );
aa_L_extend = ( endval_L_extend - startval_L_extend ) / ( endbar_L_extend - startbar_L_extend );
bb_L_extend = startval_L;
trendline_L_extend = aa_L_extend * ( xx - startbar_L ) + endval_L_extend;
dtrendline_L_extend = trendline_L_extend - Ref( trendline_L_extend, -1 );
dtrendline_L_extend = IIf( PLow, Ref( dtrendline_L, -1 ), dtrendline_L_extend );
startval_L_extend2 = ValueWhen( PLow, L, 3 );
endval_L_extend2 = ValueWhen( PLow, L, 2 );
startbar_L_extend2 = ValueWhen( PLow, xx, 3 );
endbar_L_extend2 = ValueWhen( PLow, xx, 2 );
aa_L_extend2 = ( endval_L_extend2 - startval_L_extend2 ) / ( endbar_L_extend2 - startbar_L_extend2 );
bb_L_extend2 = endval_L_extend2;
trendline_L_extend2 = aa_L_extend2 * ( xx - endbar_L_extend2 ) + endval_L_extend2;
dtrendline_L_extend2 = trendline_L_extend2 - Ref( trendline_L_extend2, -1 );
dtrendline_L_extend2 = IIf( PLow, Ref( dtrendline_L_extend, -1 ), dtrendline_L_extend2 );
startval_H = ValueWhen( PHigh, H, 1 );
endval_H = ValueWhen( PHigh, H, 0 );
startbar_H = ValueWhen( PHigh, xx, 1 );
endbar_H = ValueWhen( PHigh, xx, 0 );
aa_H = ( endval_H - startval_H ) / ( endbar_H - startbar_H );
bb_H = startval_H;
trendline_H = aa_H * ( xx - startbar_H ) + bb_H;
dtrendline_H = trendline_H - Ref( trendline_H, -1 );
startval_H_extend = ValueWhen( PHigh, H, 2 );
endval_H_extend = ValueWhen( PHigh, H, 1 );
startbar_H_extend = ValueWhen( PHigh, xx, 2 );
endbar_H_extend = ValueWhen( PHigh, xx, 1 );
aa_H_extend = ( endval_H_extend - startval_H_extend ) / ( endbar_H_extend - startbar_H_extend );
bb_H_extend = startval_H;
trendline_H_extend = aa_H_extend * ( xx - startbar_H ) + endval_H_extend;
dtrendline_H_extend = trendline_H_extend - Ref( trendline_H_extend, -1 );
dtrendline_H_extend = IIf( PHigh, Ref( dtrendline_H, -1 ), dtrendline_H_extend );
startval_H_extend2 = ValueWhen( PHigh, H, 3 );
endval_H_extend2 = ValueWhen( PHigh, H, 2 );
startbar_H_extend2 = ValueWhen( PHigh, xx, 3 );
endbar_H_extend2 = ValueWhen( PHigh, xx, 2 );
aa_H_extend2 = ( endval_H_extend2 - startval_H_extend2 ) / ( endbar_H_extend2 - startbar_H_extend2 );
bb_H_extend2 = endval_H_extend2;
trendline_H_extend2 = aa_H_extend2 * ( xx - endbar_H_extend2 ) + endval_H_extend2;
dtrendline_H_extend2 = trendline_H_extend2 - Ref( trendline_H_extend2, -1 );
dtrendline_H_extend2 = IIf( PHigh, Ref( dtrendline_H_extend, -1 ), dtrendline_H_extend2 );
tld = ParamToggle( "All trendlines", "show|hide", 1 );
if( tld )
{
trendline_L = IIf( dtrendline_L > 0, trendline_L, Null );
trendline_L_extend = IIf( dtrendline_L_extend > 0, trendline_L_extend, Null );
trendline_L_extend2 = IIf( dtrendline_L_extend2 > 0, trendline_L_extend2, Null );
trendline_H = IIf( dtrendline_H < 0, trendline_H, Null );
trendline_H_extend = IIf( dtrendline_H_extend < 0, trendline_H_extend, Null );
trendline_H_extend2 = IIf( dtrendline_H_extend2 < 0, trendline_H_extend2, Null );
}
trendline_L_extend2 = IIf( BarsSince( Plow ) <= nbar, trendline_L_extend2, Null );
trendline_H_extend2 = IIf( BarsSince( PHigh ) <= nbar, trendline_H_extend2, Null );
GraphXSpace = 5;
SetChartOptions( 0, chartShowDates );
if( chartFlag )
{
PlotOHLC( O, H, L, C, "Data", colorWhite, styleBar | styleThick );
}
else
{
HaClose = ( O + H + L + C ) / 4;
HaOpen = AMA( Ref( HaClose, -1 ), 0.5 );
HaHigh = Max( H, Max( HaClose, HaOpen ) );
HaLow = Min( L, Min( HaClose, HaOpen ) );
PlotOHLC( HaOpen, HaHigh, HaLow, HaClose, "Modified " + Name(), colorWhite, styleBar );
}
PlotShapes( shapeUpArrow * PLow, colorYellow, 0, L, -20 );
PlotShapes( shapeDownArrow * PHigh, colorWhite, 0, H, -20 );
Plot( trendline_L, "", colorLime, styleLine | styleThick );
Plot( IIf( BarsSince( Plow ) <= nbar, trendline_L_extend, Null ), "", colorLightGrey, styleLine | styleThick );
Plot( IIf( BarsSince( Plow ) > nbar, trendline_L_extend, Null ), "", colorBrightGreen, styleLine | styleThick );
Plot( IIf( BarsSince( Plow ) <= nbar, trendline_L_extend2, Null ), "", colorDarkGreen, styleLine | styleThick );
Plot( trendline_H, "", colorRed, styleLine | styleThick );
Plot( IIf( BarsSince( PHigh ) <= nbar, trendline_H_extend, Null ), "", colorLightGrey, styleLine | styleThick );
Plot( IIf( BarsSince( PHigh ) > nbar, trendline_H_extend, Null ), "", colorOrange, styleLine | styleThick );
Plot( IIf( BarsSince( PHigh ) <= nbar, trendline_H_extend2, Null ), "", colorOrange, styleLine | styleThick );
signalFlag = ParamToggle( "Possible Signals", "show|hide", 1 );
if( signalFlag )
{
Buy = ( !IsEmpty( trendline_H_extend ) AND Cross( C, trendline_H_extend ) AND BarsSince( PHigh ) > nbar ) OR
( !IsEmpty( trendline_H_extend2 ) AND Cross( C, trendline_H_extend2 ) AND !PHigh ) OR
( PHigh AND C > trendline_H_extend2 AND Ref( C, -1 ) < Ref( trendline_H_extend, -1 ) AND !IsEmpty( trendline_H_extend ) AND !IsEmpty( trendline_H_extend2 ) );
BuyPrice = C;
Short = ( !IsEmpty( trendline_L_extend ) AND Cross( trendline_L_extend, C ) AND BarsSince( PLow ) > nbar ) OR
( !IsEmpty( trendline_L_extend2 ) AND Cross( trendline_L_extend2, C ) AND !PLow ) OR
( PLow AND C < trendline_L_extend2 AND Ref( C, -1 ) > Ref( trendline_L_extend, -1 ) AND !IsEmpty( trendline_L_extend ) AND !IsEmpty( trendline_L_extend2 ) );
ShortPrice = C;
Sell = 0;
Cover = 0;
}
_SECTION_END();
_SECTION_BEGIN( " EXPLORE" );
AL = ( !IsEmpty( trendline_H_extend ) AND Cross( C, trendline_H_extend ) AND BarsSince( PHigh ) > nbar ) OR
( !IsEmpty( trendline_H_extend2 ) AND Cross( C, trendline_H_extend2 ) AND !PHigh ) OR
( PHigh AND C > trendline_H_extend2 AND Ref( C, -1 ) < Ref( trendline_H_extend, -1 ) AND !IsEmpty( trendline_H_extend ) AND !IsEmpty( trendline_H_extend2 ) );
BuyPrice = C;
SAT = ( !IsEmpty( trendline_L_extend ) AND Cross( trendline_L_extend, C ) AND BarsSince( PLow ) > nbar ) OR
( !IsEmpty( trendline_L_extend2 ) AND Cross( trendline_L_extend2, C ) AND !PLow ) OR
( PLow AND C < trendline_L_extend2 AND Ref( C, -1 ) > Ref( trendline_L_extend, -1 ) AND !IsEmpty( trendline_L_extend ) AND !IsEmpty( trendline_L_extend2 ) );
ShortPrice = C;
AL_status = WriteIf( AL, "Al?s, Yap", " " );
SAT_status = WriteIf( SAT, "Sat?s, Yap", " " );
AL_col = IIf( AL, colorDarkGreen , colorWhite );
SAT_col = IIf( SAT, colorRed, colorWhite );
Filter = AL OR SAT;
AddColumn( C, "KAPANIS,", 1.2, IIf( C > Ref( C, -1 ), colorBlue, colorRed ) );
AddTextColumn( AL_status, "ALIS,", 1.2, colorWhite, Al_col );
AddTextColumn( SAT_status, "SATIS,", 1.2, colorWhite, SAT_col );
}
_SECTION_END();
_SECTION_BEGIN( "Parabolic Sar" );
acc = Param( "Acceleration factor", 0.02, 0.01, 0.05, 0.01 );
af_start = Param( "Starting AF value", 0.02, 0.01, 0.05, 0.01 );
af_max = Param( "Maximum AF value", 0.2, 0.1, 0.3, 0.01 );
Ct = Param( "Crossover threshold in %", 1, 0, 3, 0.5 );
PS = ParamToggle( " Parabolic Sar Göstermek ", "hide|show", 0 );
Ct1 = Ct / 100;
IAF = acc;
MaxAF = af_max;
psar = Close;
long = 1;
af = af_start;
ep = Low[ 0 ];
hp = High [ 0 ];
lp = Low [ 0 ];
for( i = 2; i < BarCount; i++ )
{
if( long )
{
psar [ i ] = psar [ i - 1 ] + af * ( hp - psar [ i - 1 ] );
}
else
{
psar [ i ] = psar [ i - 1 ] + af * ( lp - psar [ i - 1 ] );
}
reverse2 = 0;
if( long )
{
if( Low [ i ] < psar [ i ] * ( 1 - Ct1 ) )
{
long = 0;
reverse2 = 1;
psar [ i ] = hp;
lp = Low [ i ];
af = af_start;
}
}
else
{
if( High [ i ] > psar [ i ] * ( 1 + Ct1 ) )
{
long = 1;
reverse2 = 1;
psar [ i ] = lp;
hp = High [ i ];
af = af_start;
}
}
if( reverse2 == 0 )
{
if( long )
{
if( High [ i ] > hp )
{
hp = High [ i ];
af = af + IAF;
if( af > MaxAF ) af = MaxAF;
}
if( Low[ i - 1 ] < psar[ i ] ) psar[ i ] = Low[ i - 1 ];
if( Low[ i - 2 ] < psar[ i ] ) psar[ i ] = Low[ i - 2 ];
}
else
{
if( Low [ i ] < lp )
{
lp = Low [ i ];
af = af + IAF;
if( af > MaxAF ) af = MaxAF;
}
if( High[ i - 1 ] > psar[ i ] ) psar[ i ] = High[ i - 1 ];
if( High[ i - 2 ] > psar[ i ] ) psar[ i ] = High[ i - 2 ];
}
}
}
if( PS )
{
Plot( psar, _DEFAULT_NAME(), ParamColor( "Color", colorYellow ), styleDots | styleNoLine | styleThick );
PlotOHLC( O, H, L, C, "Data", colorWhite, styleBar | styleThick );
}
_SECTION_END();9 comments
Leave Comment
Please login here to leave a comment.
super afl.many thanks
If you have any other AFL, you could not post them?
chart is empty in ami 5.30. nothing in parameters section to select.
AFL NOT WORKING IN 5.40 … SCREEN IS EMPTY (BLACK). ADMIN PLS HELP…
hallo mr prakash2009 and anandnst jest see your parameter settings :)
@admin
sir error coming….i am using ami 6.0
Ln 720; cl 9
error 31
syntax error, unexpected ‘=’, expecting ‘(’
please help sir
I have fixed it. The problem was that that it used the variable reverse which is now a function in Amibroker.
@admin
thanks a lot sir.
@admin sir can you please add time remaining code to this afl….i am a day trader and having difficulties …
i would really appreciate your time and effort sir
thanks.