Combination SAR, LR And T3MA for Amibroker for Amibroker (AFL)
Sandipan over 14 years ago Amibroker (AFL)
The formula is a combination of Parabolic SAR, Linear Regression Channel and a moving average named T3MA. I have just combined all these in a single one which I received from various sources. Specifically if somebody plays with this 3 combinations along with the other indicator like MACD and Stochastic… gives a fantastic result. Please remember if you run back testing result of it’s alone…not a very good one. Waiting for your comments.
Screenshots
Indicator / Formula
Copy & Paste Friendly
_SECTION_BEGIN("Support and Resistance");
xx=BarIndex();x=xx;Lx=LastValue(x);
nbar=Param("N Pivot Bars",3,2,50,1);
npiv=Param("N Pivots lookback period",1,1,50,1);
PivotSymmetry=ParamToggle("Use Symmetric Pivots","Off|On",0);
CleanPivots=ParamToggle("Use Clean Pivots","Off|On",0);
srStyle=ParamToggle("S/R Style","Off|On",1);
if (PivotSymmetry)
{
fc=1;
pk=H>Ref(HHV(H,nbar*fc),-1) AND Ref(HHV(H,nbar),nbar)<=H;
pk=pk AND Lx-ValueWhen(pk,x)>nbar*fc;
tr=L<Ref(LLV(L,nbar*fc),-1) AND Ref(LLV(L,nbar),nbar)>=L;
tr=tr AND Lx-ValueWhen(tr,x)>nbar*fc;
}
else
{
fc=2;
pk=H>Ref(HHV(H,nbar*fc),-1) AND Ref(HHV(H,nbar),nbar)<=H;
pk=pk AND Lx-ValueWhen(pk,x)>nbar*fc;
tr=L<Ref(LLV(L,nbar*fc),-1) AND Ref(LLV(L,nbar),nbar)>=L;
tr=tr AND Lx-ValueWhen(tr,x)>nbar*fc;
}
px0=ValueWhen(pk,x,0); tx0=ValueWhen(tr,x,0);
px1=ValueWhen(pk,x,1); tx1=ValueWhen(tr,x,1);
px2=ValueWhen(pk,x,2); tx2=ValueWhen(tr,x,2);
px3=ValueWhen(pk,x,3); tx3=ValueWhen(tr,x,3);
ph0=ValueWhen(pk,H,0); tl0=ValueWhen(tr,L,0);
ph1=ValueWhen(pk,H,1); tl1=ValueWhen(tr,L,1);
ph2=ValueWhen(pk,H,2); tl2=ValueWhen(tr,L,2);
ph3=ValueWhen(pk,H,3); tl3=ValueWhen(tr,L,3);
if (CleanPivots)
{
pk=IIf(pk AND px0<tx0 AND ph0>ph1,False,pk);
tr=IIf(tr AND px0>tx0 AND tl0<tl1,False,tr);
pk=IIf(pk AND px2>tx1 AND ph1<=ph2,False,pk);
tr=IIf(tr AND tx2>px1 AND tl1>=tl2,False,tr);
px0=ValueWhen(pk,x,0); tx0=ValueWhen(tr,x,0);
px1=ValueWhen(pk,x,1); tx1=ValueWhen(tr,x,1);
px2=ValueWhen(pk,x,2); tx2=ValueWhen(tr,x,2);
px3=ValueWhen(pk,x,3); tx3=ValueWhen(tr,x,3);
ph0=ValueWhen(pk,H,0); tl0=ValueWhen(tr,L,0);
ph1=ValueWhen(pk,H,1); tl1=ValueWhen(tr,L,1);
ph2=ValueWhen(pk,H,2); tl2=ValueWhen(tr,L,2);
ph3=ValueWhen(pk,H,3); tl3=ValueWhen(tr,L,3);
}
GraphXSpace=20;
//SetChartOptions(0,chartShowDates);
//SetBarFillColor(IIf(C>O,ColorRGB(0,175,0),IIf(C<=O,ColorRGB(175,0,0),colorLightGrey)));
//Plot(C,"\nPrice",IIf(C>O,ColorRGB(0,175,0),IIf(C<=O,ColorRGB(175,0,0),colorLightGrey)),64,0,0,0);
//plotting circles
//PlotShapes(shapeSmallCircle*tr,IIf(Lx-ValueWhen(tr,x)>nbar,ColorRGB(0,100,0),colorWhite),0,L,-10);
//PlotShapes(shapeSmallCircle*pk,IIf(Lx-ValueWhen(pk,x)>nbar,ColorRGB(255,0,0),colorWhite),0,H,10);
if(srstyle)
{
miny=Status("axisminy");
maxy=Status("axismaxy");
for (i=1;i<=npiv;i++)
{
rr=Ref(ValueWhen(pk,H,i),-nbar);
rr=IIf(rr>maxy OR rr<miny,Null,rr);
ss=Ref(ValueWhen(tr,L,i),-nbar);
ss=IIf(ss>maxy OR ss<miny,Null,ss);
//Plot(rr,"",colorBlue,styleNoLine|styleDots,0,0,0);
//Plot(ss,"",colorRed,styleNoLine|styleDots,0,0,0);
//Buy = Cross(H,rr);
//Sell= Cross(ss,L);
//PlotShapes(IIf(Buy, shapeUpArrow, shapeNone),colorTurquoise, 0,L, Offset=-25);
//PlotShapes(IIf(Sell, shapeDownArrow, shapeNone),colorOrange, 0,H, Offset=-25);
}
}
else
{
rr=ValueWhen(pk,H);
rr1=IIf(rr AND BarsSince(pk)>nbar,rr,Null);
rr2=IIf(rr AND BarsSince(pk)<=nbar,rr,Null);
ss=ValueWhen(tr,L);
ss1=IIf(ss AND BarsSince(tr)>nbar,ss,Null);
ss2=IIf(ss AND BarsSince(tr)<=nbar,ss,Null);
//Plot(rr1,"",colorRed,1);
//Plot(rr2,"",colorLightGrey,styleDots|styleNoLine);
//Plot(ss1,"",colorGreen,1);
//Plot(ss2,"",colorLightGrey,styleDots | styleNoLine);
}
/*
Title = EncodeColor(colorGreen)+ "Intraday Trades" + EncodeColor(colorRed) +" Open-"+O+" "+"High-"+H+" "+"Low-"+L+" "+
"Close-"+C+" "+ "Vol= "+ WriteVal(V)+"\n"+EncodeColor(colorTurquoise)+" BUY ABOVE - "+RR+" "+EncodeColor(colorOrange)+
" SELL BELOW - "+SS+" ";
*/
//_SECTION_END();
GfxSetBkMode( 1 );
GfxSetTextColor( colorBrown );
GfxSelectSolidBrush(colorBlack); // this is the box background color
GfxSelectFont( "Tahoma", 20, 100 );
pxHeight = Status( "pxchartheight" ) ;
xx = Status( "pxchartwidth");
Left = 1100;
width = 280;
x = 1235;
x2 = 980;
y = pxHeight;
//GfxSelectPen( colorGreen, 1); // broader color
//GfxRoundRect( x, y - 60, x2, y , 7, 7 ) ;
//GfxTextOut( ( " Trading System "),88,y-165);
GfxTextOut( (" "),27,y-160);
//GfxTextOut( ("BUY ABOVE : "+RR+" "), 13, y-58) ; // The text format location
//GfxTextOut( ("SELL BELOW : "+SS+""), 13, y-30);
//Modified by Sandipan
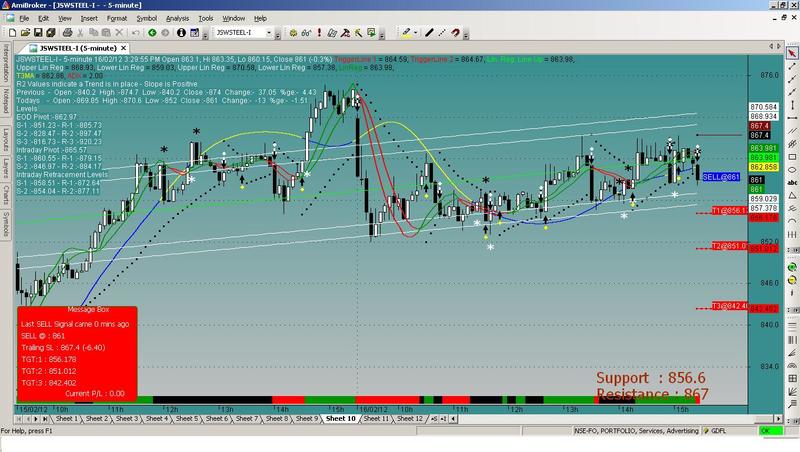
GfxTextOut( ("Support : "+SS+" "), 990, y-58) ; // The text format location
GfxTextOut( ("Resistance : "+RR+""), 990, y-30);
_SECTION_END();
_SECTION_BEGIN("Trend Lines");
p1 = Param("TL 1 Periods", 20, 5, 50, 1);
p2 = Param("TL 2 Periods", 5, 3, 25, 1);
TL1 = LinearReg(C, p1);
TL2 = EMA(TL1, p2);
Col1 = IIf(TL1 > TL2, ParamColor("TL Up Colour", colorGreen), ParamColor("TL Dn Colour", colorRed));
Plot(TL1, "TriggerLine 1", Col1, styleLine|styleThick|styleNoLabel);
Plot(TL2, "TriggerLine 2", Col1, styleLine|styleThick|styleNoLabel);
_SECTION_END();
_SECTION_BEGIN("Price");
SetChartOptions(0,chartShowArrows|chartShowDates);
SetChartBkGradientFill(ParamColor("Top", colorTeal), ParamColor("Bottom", colorLightGrey), ParamColor("Title", colorTeal));
SetChartBkColor(colorTeal);
R2PDS=20; /*for automatic adjustments to the r2 critical value line use one of the periods listed above*/
R2=Correlation(Cum( 1 ),C,r2pds)*Correlation(Cum( 1 ),C,r2pds);
slope=LinRegSlope(C,r2pds);
Crit=IIf(R2PDS==5,.77,IIf(R2PDS==10,.40,IIf(R2PDS==14,.27,IIf(R2PDS==20,.20,IIf(R2PDS==25,.16,IIf(R2PDS==30,.13,IIf(R2PDS==50,.08,IIf(R2PDS==60,.06,IIf(R2PDS==120,.03,0)))))))));
Ttl=EncodeColor(colorWhite)+ WriteIf(R2>Crit,"\nR2 Values indicate a Trend is in place","R2 Values Indicate a Trendliess Market")+WriteIf(slope>0," - Slope is Positive"," - Slope is Negative");
/*
"\n \n Interpretation \n r-squared values show the percentage of movement that can be explained by linear regression. For example, if the r-squared value over 20 days is at 70%, this means that 70% of the movement of the security is explained by linear regression. The other 30% is unexplained Random noise.\n While R2 values are interesting on their own they are easier to interpret when used in conjunction with Slope. When R2 exceeds its critical Value this indicates the market is Trending, when the indicator falls below its threshold then a trend less condition may be in place. \n This table shows the values of r-squared required for A 95% confidence level at various time periods. If the r-squared value is less than the critical values shown, you should assume that prices show no statistically significant trend. \n \n R-2 Pds Critical Value(95%confidence)"+
"\n \n 5 0.77\n 10 0.40\n 14 0.27\n 20 0.20\n 25 0.16\n 30 0.13\n 50 0.08 \n 60 0.06 \n 120 0.03"
+"\n \n You may even consider opening a Short-term position opposite the prevailing trend when you observe r-squared rounding off at extreme levels. For example, if the slope is positive AND r-squared is above 0.80 then begins to turn down, you may consider selling or opening A Short position. There are numerous ways to use the linear regression outputs of r-squared and Slope in trading systems. For more detailed coverage, refer to the book The New Technical Trader by Tushar Chande and Stanley Kroll";
*/
PO=TimeFrameGetPrice( "O", inDaily, -1 );
PL=TimeFrameGetPrice( "L", inDaily, -1 );
PH=TimeFrameGetPrice( "H", inDaily, -1 );
PC=TimeFrameGetPrice( "C", inDaily, -1 );
TO= TimeFrameGetPrice( "O", inDaily, 0 );
TH= TimeFrameGetPrice( "H", inDaily, 0 );
TL= TimeFrameGetPrice( "L", inDaily, 0 );
TC= TimeFrameGetPrice( "C", inDaily, 0 );
PC1= TimeFrameGetPrice( "C", inDaily, -2 );
P=((PH+PL+PC)/3);
R1=((2*P)-PL);
S1=((2*P)-PH);
R2=((P-S1)+R1);
S2=(P-(R1-S1));
R3=PH+(2*(P-PL));
S3=PL-(2*(PH-P));
R=TH-TL;
PP=(TH+TL+TO+TO)/4;
RR1=PP+(R*0.38);
RR2=PP+(R*0.62);
SS1=PP-(R*0.38);
SS2=PP-(R*0.62);
PPP=(TH+TL+TO+TO)/4;
RRR1=((2*PPP)-TL);
SSS1=((2*PPP)-TH);
RRR2=((PPP-SSS1)+RRR1);
SSS2=(PPP-(RRR1-SSS1));
Pchange=PC-PC1;
PPerChange=(Pchange/PC1)*100;
Tchange=TC-PC;
TPerChange=(Tchange/TC)*100;
Ttle= EncodeColor(colorWhite)+
"\nPrevious - Open :-"+PO+" High :-"+PH+" Low :-"+PL+" Close :-"+PC+" Change:- "+Pchange+" %ge:- "+WriteVal(PPerChange,1.2)+
"\nTodays - Open :-"+TO+" High :-"+TH+" Low :-"+TL+" Close :-"+TC+" Change:- "+Tchange+" %ge:- "+WriteVal(TPerChange,1.2)+
//"\n"+
//"\n"+
"\nLevels"+
"\nEOD Pivot :-"+WriteVal(P,1.2)+
"\nS-1 :-"+WriteVal(S1,1.2)+" - R-1 :-"+WriteVal(R1,1.2)+
"\nS-2 :-"+WriteVal(S2,1.2)+" - R-2 :-"+WriteVal(R2,1.2)+
"\nS-3 :-"+WriteVal(S3,1.2)+" - R-3 :-"+WriteVal(R3,1.2)+
//"\n"+
"\nIntraday Pivot :-"+WriteVal(PP,1.2)+
"\nS-1 :-"+WriteVal(SSS1,1.2)+" - R-1 :-"+WriteVal(RRR1,1.2)+
"\nS-2 :-"+WriteVal(SSS2,1.2)+" - R-2 :-"+WriteVal(RRR2,1.2)+
//"\n"+
"\nIntraday Retracement Levels"+
"\nS-1 :-"+WriteVal(SS1,1.2)+" - R-1:-"+WriteVal(RR1,1.2)+
"\nS-2 :-"+WriteVal(SS2,1.2)+" - R-2:-"+WriteVal(RR2,1.2);
//====================================Start of Linear Regression Code==================================================================================
P = ParamField("Price field",-1);
Length = 150;
Daysback = Param("Period for Liner Regression Line",Length,1,240,1);
shift = Param("Look back period",0,0,240,1);
//=============================== Math Formula ========================================================================================================
x = Cum(1);
lastx = LastValue( x ) - shift;
aa = LastValue( Ref(LinRegIntercept( p, Daysback), -shift) );
bb = LastValue( Ref(LinRegSlope( p, Daysback ), -shift) );
y = Aa + bb * ( x - (Lastx - DaysBack +1 ) );
//==================Plot the Linear Regression Line ====================================================================================================
LRColor = ParamColor("LR Color", colorCycle );
LRStyle = ParamStyle("LR Style");
LRLine = IIf( x > (lastx - Daysback) AND BarIndex() < Lastx, y, Null );
LRStyle = ParamStyle("LR Style");
Angle = Param("Angle", 0.05, 0, 1.5, 0.01);// A slope higher than 0.05 radians will turn green, less than -0.05 will turn red and anything in between will be white.
LRLine = IIf( x > (lastx - Daysback) AND BarIndex() < Lastx, y, Null );
Pi = 3.14159265 * atan(1); // Pi
SlopeAngle = atan(bb)*(180/Pi);
LineUp = SlopeAngle > Angle;
LineDn = SlopeAngle < - Angle;
if(LineUp)
{
Plot(LRLine, "Lin. Reg. Line Up", IIf(LineUp, colorBrightGreen, colorWhite), LRStyle);
}
else
{
Plot(LRLine, "Lin. Reg. Line Down", IIf(LineDn, colorDarkRed, colorWhite), LRStyle);
}
//========================== Plot 1st SD Channel ======================================================================================================
SDP = Param("Standard Deviation", 1.5, 0, 6, 0.1);
SD = SDP/2;
width = LastValue( Ref(SD*StDev(p, Daysback),-shift) ); //Set width of inside chanels here.
SDU = IIf( x > (lastx - Daysback) AND BarIndex() < Lastx, y+width , Null ) ;
SDL = IIf( x > (lastx - Daysback) AND BarIndex() < Lastx, y-width , Null ) ;
SDColor = ParamColor("SD Color", colorCycle );
SDStyle = ParamStyle("SD Style");
//Plot( SDU , "\nUpper Lin Reg", colorWhite,SDStyle ); //Inside Regression Lines
//Plot( SDL , "Lower Lin Reg", colorWhite,SDStyle ); //Inside Regression Lines
//========================== Plot 2d SD Channel ========================================================================================================
SDP2 = Param("2d Standard Deviation", 2.0, 0, 6, 0.1);
SD2 = SDP2/2;
width2 = LastValue( Ref(SD2*StDev(p, Daysback),-shift) ); //Set width of outside chanels here.
SDU2 = IIf( x > (lastx - Daysback) AND BarIndex() < Lastx, y+width2 , Null ) ;
SDL2 = IIf( x > (lastx - Daysback) AND BarIndex() < Lastx, y-width2 , Null ) ;
SDColor2 = ParamColor("2 SD Color", colorCycle );
SDStyle2 = ParamStyle("2 SD Style");
//Plot( SDU2 , "Upper Lin Reg", colorWhite,SDStyle2 ); //OutSide Regression Lines
//Plot( SDL2 , "Lower Lin Reg", colorWhite,SDStyle2 ); //OutSide Regression Lines
Trend = IIf(LRLine > Ref(LRLine,-1),colorGreen,colorRed);//Changes LR line to green if sloping up and red if sloping down.
Plot( LRLine , "LinReg", Trend, LRSTYLE );
//============================ End Indicator Code ========================================================================================================
_N(Title = EncodeColor(55)+StrFormat("{{NAME}} - {{INTERVAL}} {{DATE}} Open %g, Hi %g, Lo %g, Close %g (%.1f%%) {{VALUES}}", O, H, L, C, SelectedValue( ROC( C, 1 ) ) )+" "+Ttl+Ttle);
Plot( C, "Close", ParamColor("Color", colorBlack ), styleNoTitle | ParamStyle("Style") | GetPriceStyle() );
_SECTION_END();
_SECTION_BEGIN("SAR");
//P = ParamField( "Price field" );
//T3MA toggle
T3MAT=ParamToggle("Moving Average","No|Yes",defaultval=1 );
T3MAP = Param("T3MA Periods", 21, 2, 300, 1, 10 );
function T3(price,periods)
{
s = 0.84;
e1=EMA(price,periods);
e2=EMA(e1,Periods);
e3=EMA(e2,Periods);
e4=EMA(e3,Periods);
e5=EMA(e4,Periods);
e6=EMA(e5,Periods);
c1=-s*s*s;
c2=3*s*s+3*s*s*s;
c3=-6*s*s-3*s-3*s*s*s;
c4=1+3*s+s*s*s+3*s*s;
Ti3=c1*e6+c2*e5+c3*e4+c4*e3;
return ti3;
}
T3MA = T3(P,T3MAP);
//T3MA Display
//T3MAB1=0;
//T3MAS1=0
if(T3MAT==1)
{
T3MABuy = Cross(C,T3MA);
//if(T3MABuy)
//T3MAB1=1;
T3MASell = Cross(T3MA,C);
//if(T3MASell)
//T3MAS1=1;
T3MAcolor = IIf(C>=T3MA,colorBlue,colorYellow);
Plot(T3MA,"\nT3MA",T3MAcolor,styleThick);
PlotShapes(shapeStar*T3MABuy,colorWhite,0,L,-20);
PlotShapes(shapeStar*T3MASell,colorBlack,0,H,20);
//T3MAShape = T3MABuy * shapeHollowStar + T3MASell * shapeHollowStar;
//PlotShapes(T3MAShape, IIf(T3MABuy ,colorGreen,colorRed), 0,IIf(T3MABuy ,Low,High));
}
//mau = TEMA(C,20);
//Plot(Ref(mau, -1),"MA20", colorGreen, styleThick) ;
//mav = TEMA(C,50);
//Plot(Ref(mav, -1),"MA50", colorGold, styleThick) ;
/*for automatic adjustments to the r2 critical value line use one of the periods listed above*/
/*
R2PDS=20;
R2=Correlation(Cum( 1 ),C,r2pds)*Correlation(Cum( 1 ),C,r2pds);
slope=LinRegSlope(C,r2pds);
Crit=IIf(R2PDS==5,.77,IIf(R2PDS==10,.40,IIf(R2PDS==14,.27,IIf(R2PDS==20,.20,IIf(R2PDS==25,.16,IIf(R2PDS==30,.13,IIf(R2PDS==50,.08,IIf(R2PDS==60,.06,IIf(R2PDS==120,.03,0)))))))));
*/
//Title=WriteIf(R2>Crit,"R2 Values indicate a Trend is in place","R2 Values Indicate a Trendliess Market")+WriteIf(slope>0,"\n Slope is Positive","\n Slope is Negative");
/*
"\n \n Interpretation \n r-squared values show the percentage of movement that can be explained by linear regression. For example, if the r-squared value over 20 days is at 70%, this means that 70% of the movement of the security is explained by linear regression. The other 30% is unexplained Random noise.\n While R2 values are interesting on their own they are easier to interpret when used in conjunction with Slope. When R2 exceeds its critical Value this indicates the market is Trending, when the indicator falls below its threshold then a trend less condition may be in place. \n This table shows the values of r-squared required for A 95% confidence level at various time periods. If the r-squared value is less than the critical values shown, you should assume that prices show no statistically significant trend. \n \n R-2 Pds Critical Value(95%confidence)"+
"\n \n 5 0.77\n 10 0.40\n 14 0.27\n 20 0.20\n 25 0.16\n 30 0.13\n 50 0.08 \n 60 0.06 \n 120 0.03"
+"\n \n You may even consider opening a Short-term position opposite the prevailing trend when you observe r-squared rounding off at extreme levels. For example, if the slope is positive AND r-squared is above 0.80 then begins to turn down, you may consider selling or opening A Short position. There are numerous ways to use the linear regression outputs of r-squared and Slope in trading systems. For more detailed coverage, refer to the book The New Technical Trader by Tushar Chande and Stanley Kroll";
*/
acc = Param("Acceleration", 0.1, 0, 1, 0.001 );
accm = Param("Max. acceleration", 0.06, 0, 1, 0.001 );
SAR1 = SAR(acc,accm);
//Buy1 = Cross(Open, SAR(acc,accm)) AND (T3MAB1==1);
//Sell1 = Cross(SAR(acc,accm), Open ) AND (T3MAS1==1);
Buy1 = Cross(Open, SAR(acc,accm));
Sell1 = Cross(SAR(acc,accm), Open );
if (ParamToggle("SAR","Show|Hide",1)){
Plot(SAR1,"",1,styleDots|styleNoLine);
PlotShapes(IIf(Buy1,shapeUpArrow,shapeNone), colorYellow, 0, Low, Offset=-15);
PlotShapes(IIf(Buy1,shapeSmallCircle,shapeNone), colorYellow, 0, Low, Offset=-28);
PlotShapes(IIf(Sell1, shapeDownArrow,shapeNone), colorWhite, 0, High, Offset=-15);
PlotShapes(IIf(Sell1, shapeSmallCircle,shapeNone), colorWhite, 0, High, Offset= 28);
}
_SECTION_END();
messageboard = ParamToggle("Message Board","Show|Hide",0);
exitlong = Sell1;
PlotShapes(exitlong * shapeDownArrow, colorBlack,0,H,-10);
exitshort = Buy1;
PlotShapes(exitshort * shapeUpArrow, colorBlack,0,L,-15);
Buy = exitshort;
Sell = exitlong;
Buy = ExRem(Buy,Sell);
Sell = ExRem(Sell,Buy);
AlertIf( Buy, "", "BUY @ " + C, 1 );
AlertIf( Sell, "", "SELL @ " + C, 2 );
for(i=BarCount-1;i>1;i--)
{
if(Buy[i] == 1)
{
entry = C[i];
sig = "BUY";
sl = sar1[i];
tar1 = entry + (entry * .0056);
tar2 = entry + (entry * .0116);
tar3 = entry + (entry * .0216);
bars = i;
i = 0;
}
if(Sell[i] == 1)
{
sig = "SELL";
entry = C[i];
sl = SAR1[i];
tar1 = entry - (entry * .0056);
tar2 = entry - (entry * .0116);
tar3 = entry - (entry * .0216);
bars = i;
i = 0;
}
}
Offset = 20;
Clr = IIf(sig == "BUY", colorLime, colorRed);
ssl = IIf(bars == BarCount-1, sar1[BarCount-1], Ref(SAR1, -1));
sl = ssl[BarCount-1];
Plot(LineArray(bars-Offset, tar1, BarCount, tar1,1), "", Clr, styleLine|styleDots, Null, Null, Offset);
Plot(LineArray(bars-Offset, tar2, BarCount, tar2,1), "", Clr, styleLine|styleDots, Null, Null, Offset);
Plot(LineArray(bars-Offset, tar3, BarCount, tar3,1), "", Clr, styleLine|styleDots, Null, Null, Offset);
Plot(LineArray(bars-Offset, sl, BarCount, sl,1), "", colorDarkRed, styleLine|styleLine, Null, Null, Offset);
Plot(LineArray(bars-Offset, entry, BarCount, entry,1), "", colorGreen, styleLine|styleLine, Null, Null, Offset);
for (i=bars; i <BarCount;i++)
{
PlotText(""+sig+"@"+entry, BarCount+1,entry,Null,colorBlue);
PlotText("T1@"+tar1,BarCount+3,tar1,Null,Clr);PlotText("T2@"+tar2,BarCount+3,tar2,Null,Clr);PlotText ("T3@"+tar3,BarCount+3,tar3,Null,Clr);
}
printf("Last " + sig + " Signal came " + (BarCount-bars) + " bars ago");
printf("\n" + sig + " @ : " + entry + "\nStop Loss : " + sl + " (" + WriteVal(IIf(sig == "SELL",entry-sl,sl-entry), 2.2) + ")"+ "\nTarget_1 : " + tar1 + "\nTarget_2 : " + tar2 + "\nTarget_3 : " + tar3);
printf("\nCurrent P/L : " + WriteVal(IIf(sig == "BUY",(C-entry),(entry-C)),2.2));
if (messageboard == 0 )
{
GfxSelectFont( "Tahoma", 9, 100 );
GfxSetBkMode( 1 );
GfxSetTextColor( colorWhite );
if ( sig =="BUY")
{
GfxSelectSolidBrush( colorBlue ); // this is the box background color
}
else
{
GfxSelectSolidBrush( colorRed ); // this is the box background color
}
pxHeight = Status( "pxchartheight" ) ;
xx = Status( "pxchartwidth");
Left = 1100;
width = 310;
x = 5;
x2 = 210;
y = pxHeight;
GfxSelectPen( colorGreen, 1); // broader color
GfxRoundRect( x, y - 163, x2, y , 7, 7 ) ;
GfxTextOut( ( " Message Box "),88,y-165);
GfxTextOut( (" "),27,y-160);
GfxTextOut( ("Last " + sig + " Signal came " + (BarCount-bars-1) * Interval()/60 + " mins ago"), 13, y-140) ; // The text format location
GfxTextOut( ("" + WriteIf(sig =="BUY",sig + " @ ",sig + " @") + " : " + entry), 13, y-120);
GfxTextOut( ("Trailing SL : " + sl + " (" + WriteVal(IIf(sig == "SELL",entry-sl,sl-entry), 2.2) + ")"), 13, y-100);
GfxTextOut( ("TGT:1 : " + tar1), 13, y -80);
GfxTextOut( ("TGT:2 : " + tar2), 13,y-60);
GfxTextOut( ("TGT:3 : " + tar3), 13,y-40);
GfxTextOut( ("Current P/L : " + WriteVal(IIf(sig == "BUY",(C-entry),(entry-C)),2.2)), 88, y-22);;
}
_SECTION_BEGIN("ADX");
uptrend=PDI()>MDI()AND Signal()<MACD();
downtrend=MDI()>PDI()AND Signal()>MACD();
Plot( 2, "ADX",IIf( uptrend, colorGreen, IIf( downtrend, colorRed, colorBlack )), styleOwnScale|styleArea|styleNoLabel, -0.5, 100 );
_SECTION_END();
GraphXSpace=5;7 comments
Leave Comment
Please login here to leave a comment.
This formula looks into the future so its value for trading is limited and good results are certainly suspect.
In addition, why do you think that simply putting indicators together that the result will be particularly good? What is your logic for choosing which indicators should be lumped together?
Nice formula. I don’t think that it looks into future because it don’t change signal after appearing one candle after the signal candle. It will be very useful if used with other indicators like MACD RSI & True Strength Index.
Rakesh,
Thanks for supporting me and u caught me perfectly. I will try it with True Strength Index also as I tried this with MACD and Stochastic.
Ole,
As per as my knowledge goes, it does not looks into the future. My suggestion also try with MACD, RSI/Stochastic. I hope my answer satisfies you.
Of course it looks into the future and it makes no difference if you use MACD, etc.
You guys obviously do not know how to check if a formula looks into the future and is therefore of no value (or at most limited value) for trading. To do so go to Tools > Code Check and Profile menu. For this formula you will get the following message (I would insert a screenshot but that does not appear to be possible) plus execution statistics:
“It seems that the formula references FUTURE quotes.
If you backtest this system you may receive outstanding results
that CAN NOT be reproduced in real trading.
769 data bars used during this check. Total execution time: 0.0225798 sec.
Approximately 49473 past and ALL future quotes are needed to calculate the formula properly."
Good point ole. Many forget that future looking code is taboo when it comes to trading.
There’s no taboo to use the future looking code in trading. I usually use it and it works greatly. You have to find how to deal with the code, whether it’s a future looking or not.
If you don’t know how to use that code in trading in usual way, use unusual way and there’s no taboo with that. When it comes with a big profit, you’ll know what i’m talking about.
This system uses mainly two indicators SAR & T3MA. Both indicator are not future looking & signals are static. Mostly future looking indicator use Pivot & signals are dynamic. One addition indicator trend lines of 5 & 20 is also there. One should take entry and exit after considering all aspects. More ever no single indicator is completely perfect.