Stock Portfolio Organizer
The ultimate porfolio management solution.
WiseTrader Toolbox
#1 Selling Amibroker Plugin featuring:
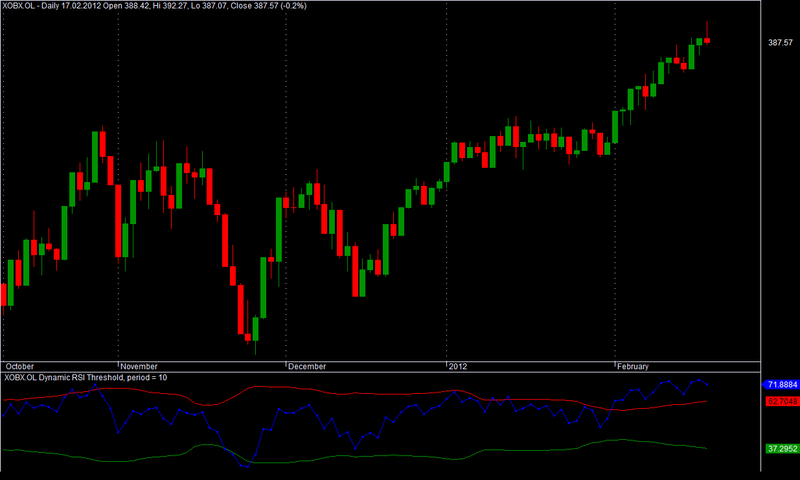
Dynamic RSI for Amibroker (AFL)
// Dynamic RSI Thresholds — J. Varney
/*
Instead of the traditional fixed RSI = 30 and 70 thresholds to define
oversold and overbought, this AFL uses standard deviation to determine
dynamic overbought and oversold theshold lines.
*/
Screenshots
Similar Indicators / Formulas
Indicator / Formula
Period = Param("Period", 10, 2, 30, 1);
myRSI = RSI(Period);
Adev = StDev(myRSI, 3*Period);
Hiline = 50 + 1.8*Adev;
Loline = 50 - 1.8*Adev;
Plot(myRSI,"",colorBlue,8);
Plot(Hiline,"",colorRed,1);
Plot(Loline,"",colorGreen,1);
Title = " " +Name() +
" Dynamic RSI Threshold, t = " +
WriteVal(period, format=1.0) + " ";
6 comments
Leave Comment
Please login here to leave a comment.
Back
How do you know that this is an improvment? What are you backtest results?
Re: ole
I have not said this indicator is better or worse than the standard RSI. You have to test if for yourself.
I have tested it on a few stocks and indices and as far as I can see it gives a little better results than standard RSI.
Hey Joeoil, thanks for posting this code. I used your Std Dev idea in another way, by adding/subtracting it to a moving average of the RSI and got some pretty good results. I actually made three trades using the signals today.
AlgoTrader
If possible, can I ask you how you write the AFL when you add/subtr StdDev to the moving averages of RSI?
I’m not that good in AFL programming, but I think it could have been interesting to see how your code works out with the stocks/indexes I trade.
It is no problem if you don’t wan’t to share the code.
Regards
Joeoil
interested to try this on different asset classes
Maybe you like this.
//xxxxxxxxxxxxxxxxxxxxxxxxxxxxxxxxxxxxxxxxxxxxxxxxxxxxxxxxxxxxxxxxxxxxxxxxxxxxxxxxxxxxxxxxxxxxxxxxxxxxxxxxxxxxxxxxxxxxxxxxxx
//TRENDADVISOR
pointer0 = 0;
/* Phase filter */
Cond1 = Close > MAAND NOT)AND NOT > MA);
Cond2 = Close > MAAND Close > MAAND NOT > MA);
Cond3 = Close > MAAND Close > MAAND MA > MA;
Cond4 = NOT)AND Close > MAAND MA > MA;
Cond5 = NOT)AND NOT)AND MA > MA;
Cond6 = NOT)AND NOT)AND NOT > MA);
for (i = 1; i < BarCount; i++)
if (Cond1[i]) pointer[i] = 1; if (Cond2[i]) pointer[i] = 2; if (Cond3[i]) pointer[i] = 3; if (Cond4[i]) pointer[i] = 4; if (Cond5[i]) pointer[i] = 5; if (Cond6[i]) pointer[i] = 6;{
}
/* Plot Graphic */
//GraphXSpace= 15 ;
dynamic_color = IIf(pointer < 4, colorGreen, colorRed);
//Plot(pointer, “TrendAdv2”, dynamic_color, styleHistogram | styleThick, Null, Null, 0);
//SetChartBkGradientFill(ParamColor(“BgTop”, colorWhite), ParamColor(“BgBottom”, colorLightYellow));
Cond= pointer<4 ;
//xxxxxxxxxxxxxxxxxxxxxxxxxxxxxxxxxxxxxxxxxxxxxxxxxxxxxxxxxxxxxxxxxxxxxxxxxxxxxxxxxxxxxxxxxxxxxxxxxxxxxxxx
//xxxxxxxxxxxxxxxxxxxxxxxxxxxxxxxxxxxxxxxxxxxxxxxxxxxxxxxxxxxxxxxxxxxxxxxxxxxxxxxxxxxxxxxxxxxxxxxx
//FORMULE
stoch20up80 = StochK()>StochD() AND StochK()>20 OR StochK()>=80 ;
MACDup= MACD ;
MACDup0= MACD-Signal() ;
Histup= Hist>Ref(Hist,-1) ;
macdhistup= MACD AND Hist>Ref(Hist,-1) ;
macdstoch20dn= MACD AND StochK()<StochD() AND StochK()<80 OR StochK()<20 ;
histstochdn= Hist<Ref(Hist,-1) AND StochK()<StochD() AND StochK()<80 OR StochK()<20 ;
histstoch20up= Hist>Ref(Hist,-1) AND StochK()>StochD() AND StochK()>20 ;
CCIup0MA= CCI,7) AND CCI>=Ref(MA,-1) ;
PDIupmdi= PDI ;
Uptrend= MACD AND PDI ;
Uportrend= MACD OR PDI ;
Dntrend= MACD AND PDI ;
Dnortrend= MACD OR PDI ;
cup = C>=Ref(C,-1) ;
//xxxxxxxxxxxxxxxxxxxxxxxxxxxxxxxxxxxxxxxxxxxxxxxxxxxxxxxxxxxxxxxxxxxxxxxxxxxxxxxxxxxxxxxxxxxxxxxxxxxxxxxxxxxxx
//xxxxxxxxxxxxxxxxxxxxxxxxxxxxxxxxxxxxxxxxxxxxxxxxxxxxxxxxxxxxxxxxxxxxxxxxxxxxxxxxxxxxxxxxxxxxxxxxx
// Downloaded From https://www.WiseStockTrader.com
// by Joeoil
//RSI() = 14 // per = 14 by default
SetChartOptions(0,chartShowArrows|chartShowDates);
Period = Param(“Period”, 14, 2, 30, 1);
myRSI = RSI;
marsi = MA ;
Adev = StDev(myRSI, 3*Period);
Hiline = 50 + 1.8*Adev;
Loline = 50 – 1.8*Adev;
mid = (Hiline + Loline)/2 ;
//Plot(myRSI,"",colorBlue,8);
Plot(myRSI,“myRSI&DynamicResSupp”,colorBlack,styleDots+styleThick );
Plot(maRSI,“MA”,colorRed,styleLine+styleThick );
Plot(Hiline,“Res”,colorRed,styleLine+styleThick );
Plot(Loline,“Supp”,colorGreen,styleLine+styleThick);
Plot(mid,“Mid”,colorBlue,styleLine+styleThick);
myrsiup = myRSI>=Ref(myRSI,-1) ;
/*
MODEL
cloudcol = IIf(bbupcond,colorAqua ,
IIf(bbdncond,colorPink ,colorYellow)) ;
PlotOHLC( bbt, bbt, bbb, bbb, "", cloudcol , styleNoLabel | styleCloud | styleNoRescale, Null, Null, Null, -1 );
*/
cloudcol = IIf(cond AND (myRSI>=mid AND myRSI>marsi OR myRSI>=Hiline),colorAqua ,
IIf(myRSI<mid OR !cond, colorPink , colorYellow )) ;
PlotOHLC( Hiline, Hiline, Loline, Loline, "", cloudcol , styleNoLabel | styleCloud | styleNoRescale, Null, Null, Null, -1 );
/*
Title = " " +Name() +
" Dynamic RSI Threshold, t = " +
WriteVal(period, format=1.0) + " ";
*/
//xxxxxxxxxxxxxxxxxxxxxxxxxxxxxxxxxxxxxxxxxxxxxxxxxxxxxxxxxxxxxxxxxxxxxxxxxxxxxxxxxxxxxxxxxxxxxxxxxxxxxxxxxxxxxxxxxxxxxxxxxxxxxxxxxxxxxx
//xxxxxxxxxxxxxxxxxxxxxxxxxxxxxxxxxxxxxxxxxxxxxxxxxxxxxxxxxxxxxxxxxxxxxxxxxxxxxxxxxxxxxxxxxxxxxxxxxxxxxxxxxxxxxxx
//FORMULE
stochup= StochK()>StochD() ;
stochdn80= StochK()<80 ;
stochtotdn= (StochK()<StochD() AND StochK()<80) ;
MACDup= MACD ;
MACDup0= MACD-Signal() ;
Histup= Hist>Ref(Hist,-1) ;
MACDhistup = MACD AND Hist>Ref(Hist,-1) ;
MACDstoch20dn = MACD AND StochK()<StochD() AND StochK()<80 OR StochK()<20 ;
MFIup30ma = MFI,7) AND MFI>MA(CCI ;
PDIupmdi= PDI ;
PDIup20= PDI>Signal() AND PDI) ;
Dntrend= (MACD AND PDI) ;
//xxxxxxxxxxxxxxxxxxxxxxxxxxxxxxxxxxxxxxxxxxxxxxxxxxxxxxxxxxxxxxxxxxxxxxxxxxxxxxxxxxxxxxxxxxxxxxxxxxxxxxxxxxxxxxxxxx
//PARAMTOGGLE
// This combines indicators into one timing Signal
//function ParamOptimize( description, default, minv, maxv, step )
// { return Optimize(description, Param(description,default, minv, maxv, step ), minv, maxv, step ); }
tgl = ParamToggle(“Result”, “AND logic|Compare”);
// switch test calculation and compare the results
if(tgl)
{
myBuy = cond AND (myRSI>=mid AND myRSI>marsi OR myRSI>=Hiline) ;
myShort = myRSI<mid OR !cond ;
}
else
{
myBuy = IIf( pointer<4 AND (myRSI>=mid AND myRSI>marsi OR myRSI>=Hiline) ,1,0);
myShort = IIf( myRSI<mid OR pointer>=4 ,1,0);
}
Buy = ExRem(myBuy, myShort) ;
Sell = ExRem(myShort, myBuy) ;
StrongBuy = Buy AND (macdhistup OR uptrend) AND mfiup30ma ;
MediumBuy = Buy AND (macdhistup OR uptrend) ;
WeakBuy = Buy ;
StrongSell = Sell AND (macdstoch20dn OR dntrend) AND !mfiup30ma ;
MediumSell = Sell AND (macdstoch20dn OR dntrend) ;
WeakSell = Sell ;
PlotShapes(IIf(StrongBuy,shapeUpTriangle,shapeNone),colorBlue,0 );
PlotShapes(IIf(MediumBuy,shapeUpArrow,shapeNone),colorBlue,0 );
PlotShapes(IIf(WeakBuy,shapeHollowUpArrow,shapeNone),colorBlue,0 );
PlotShapes(IIf(StrongSell,shapeDownTriangle,shapeNone),colorRed,0 );
PlotShapes(IIf(MediumSell,shapeDownArrow,shapeNone),colorRed,0 );
PlotShapes(IIf(WeakSell,shapeHollowDownArrow,shapeNone),colorRed,0 ) ;
/*
PlotShapes(IIf(StrongBuy,shapeUpTriangle,shapeNone),colorBlue,0,Low,Offset=-20);
PlotShapes(IIf(MediumBuy,shapeUpArrow,shapeNone),colorBlue,0,Low,Offset=-20);
PlotShapes(IIf(WeakBuy,shapeHollowUpArrow,shapeNone),colorBlue,0,Low,Offset=-20);
PlotShapes(IIf(StrongSell,shapeDownTriangle,shapeNone),colorRed,0,High,Offset=-20);
PlotShapes(IIf(MediumSell,shapeDownArrow,shapeNone),colorRed,0,High,Offset=-20);
PlotShapes(IIf(WeakSell,shapeHollowDownArrow,shapeNone),colorRed,0,High,Offset=-20);
*/
/*
PlotShapes(IIf(StrongBuy,shapeUpTriangle,shapeNone),colorBlue,0,haLow,Offset=-10);
PlotShapes(IIf(MediumBuy,shapeUpArrow,shapeNone),colorBlue,0,haLow,Offset=-10);
PlotShapes(IIf(WeakBuy,shapeHollowUpArrow,shapeNone),colorBlue,0,haLow,Offset=-10);
PlotShapes(IIf(StrongSell,shapeDownTriangle,shapeNone),colorRed,0,haHigh,Offset=-10);
PlotShapes(IIf(MediumSell,shapeDownArrow,shapeNone),colorRed,0,haHigh,Offset=-10);
PlotShapes(IIf(WeakSell,shapeHollowDownArrow,shapeNone),colorRed,0,haHigh,Offset=-10);
*/
//PlotShapes(IIf(Buy,shapeUpArrow,shapeNone),colorBlue,0,haLow,Offset=-10);
//PlotShapes(IIf(Sell,shapeDownArrow,shapeNone),colorRed,0,haHigh,Offset=-10);
//PlotShapes(IIf(Buy,shapeUpArrow,shapeNone),colorBlue,0,trailArray);
//PlotShapes(IIf(Sell,shapeDownArrow,shapeNone),colorRed,0,trailArray);
//xxxxxxxxxxxxxxxxxxxxxxxxxxxxxxxxxxxxxxxxxxxxxxxxxxxxxxxxxxxxxxxxxxxxxxxxxxxxxxxxxxxxxxxxxxxxxxxxxxxxxxxxxxxxxxxxxxxxxxxxx