Trending Wave 2 System for Amibroker (AFL)
Dryden over 14 years ago Amibroker (AFL)
in development.
a system, which turn out profitable quickly without (much) optimization. Defined are only a few basic rules, so there’s potential for more. Suggestions welcome.
backtest settings as I use them.
long& short
only check activate stops immediately
trades tab
buy/sell/short/cover → delay 1
select open
profit taking disabled, go from signal to signal unless stop loss. No trailing stop not implemented yet.
stop loss is executed when triggered
Screenshots
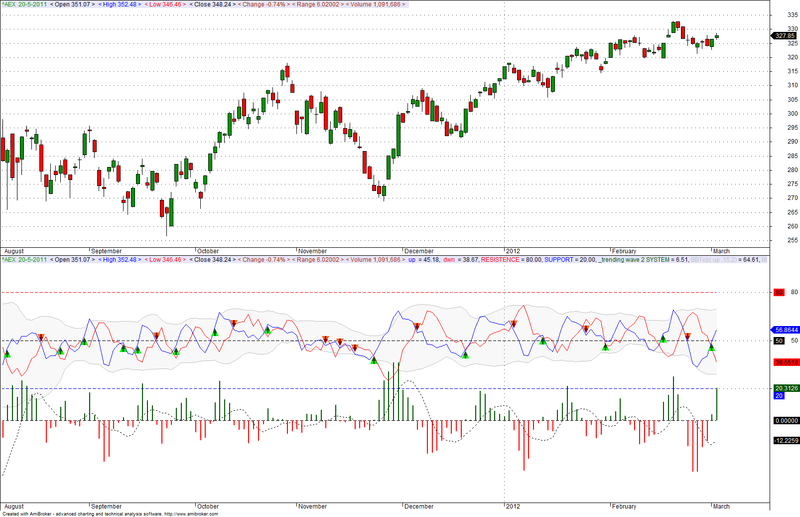
Indicator / Formula
Copy & Paste Friendly
_SECTION_BEGIN("_trending wave");
SetChartOptions(0, chartShowArrows|chartShowDates, chartGrid20 |chartGrid50 |chartGrid80);
_N(Title =EncodeColor(colorGreen)+ StrFormat("{{NAME}}  {{DATE}} " + EncodeColor(colorBlack)+" < Open %g > "+ EncodeColor(colorBlue)+ " < High %g > "+ EncodeColor(colorRed)+" < Low %g > "+ EncodeColor(colorBlack) + " < Close %g > " + EncodeColor(colorBrown ) + "< Change" +" %.2f%% > " + "< Range " +(H-L) +" >" +" < Volume "   +WriteVal( V, 1.0 ) +" >"+" {{VALUES}} ", O, H, L, C, SelectedValue( ROC( C, 1 )) ));
SetChartBkColor(ParamColor("Outer Panel Color ",colorWhite)); // color of outer border
SetChartBkGradientFill( ParamColor("Inner Panel Color Upper Half",colorWhite),
ParamColor("Inner Panel Color Lower Half",colorWhite)//color of inner panel
,ParamColor("Behind Text Color", colorLavender));
PositionSize = 1000;
SetPositionSize( 1, spsShares );
GraphXSpace=15;


Hc=(O+H+L+C)/4;

periods = Optimize("periods ",Param("periods ",20,15,20,5),15,30,5);
width = Optimize("width ",Param("width ",2,2,2,2),2,2,2);
C1 = C - BBandBot( Close, periods, width) ;
C2 = BBandTop (Close,periods,width) - BBandBot( Close, periods, width);

R = C1 / C2;
RS = (AMA( C1,  0.5 ) / AMA( C2,  0.5 )); //smooth

uptrend = r > Ref(r,-1);
downtrend = r < Ref(r,-1);

uptrendS = rs > Ref(rs,-1);
downtrendS = rs < Ref(rs,-1);

trendu= ((uptrendS +uptrend)/2);
trendd=((downtrend +downtrendS)/2);


Ho = AMA( Ref( Hc, -1 ), 0.5 );

pds = Optimize("pds ",Param("pds ",4,1,25,1),1,25,1);
myArrayu = (RSIa((Ho ), pds )+ RSIa( trendu,pds ) + Ref(RSIa(trendu,pds),-1) + Ref(RSIa(trendu,pds),-2) + Ref(RSIa(trendu,pds),-3))/5 ;
myArrayd = (RSIa((Ho ), pds )+ RSIa( trendd,pds ) + Ref(RSIa(trendd,pds),-1) + Ref(RSIa(trendd,pds),-2) + Ref(RSIa(trendd,pds),-3))/5 ;

//myArrayu1 = (AMA( myArrayu ,  0.5 )); //smooth
//myArrayd2 = (AMA( myArrayd ,  0.5 )); //smooth

BS = ParamToggle("smooth","No|Yes",1);
BN = ParamToggle("normal","No|Yes",1);

if (BS) Plot( myArrayu , " up ", IIf( myArrayu >=Ref(myArrayu ,-1), colorBlue, colorBlue));
//if (BS) Plot ( 1, "", IIf( myArrayS >Ref(myArrayS ,-1), colorGreen, IIf( myArrayS < Ref(myArrayS ,-1), colorRed, colorPink )), styleOwnScale|styleArea|styleNoLabel, -0.5, 100 );

if (BN) Plot( myArrayd , " dwn ", IIf( myArrayd >=Ref(myArrayd ,-1), colorRed , colorRed ));
//if (BN) Plot ( 2, "", IIf( myArray >Ref(myArray ,-1), colorGreen, IIf( myArray < Ref(myArray ,-1), colorRed, colorPink )), styleOwnScale|styleArea|styleNoLabel, -0.5, 100 );

Plot(80,"RESISTENCE",colorRed, styleLine|styleDashed | styleThick);
Plot(50,"",colorBlack, styleLine|styleDashed | styleThick);
Plot(20,"SUPPORT",colorBlue, styleLine|styleDashed | styleThick);
_SECTION_END();

HistInd=myArrayu - myArrayd ;

if (BS AND BN) Plot(HistInd, _DEFAULT_NAME(),
IIf(HistInd>=0, ParamColor("Up Color", colorDarkGreen), ParamColor("Down Color", colorRed)),
ParamStyle( "Style", styleHistogram | styleThick, maskHistogram ));
if (BS AND BN) Plot(0,"",colorBlack, styleLine|styleDashed | styleThick);

_SECTION_BEGIN("Average Histogram");
avpds = Optimize("average periods ",Param("average periods",7,1,7,1),1,7,1);
average=MA(Histind,avpds);
Plot(average,"",colorBlack, styleLine|styleDashed );
_SECTION_END();


C1L = Histind > average ;// AND average <Ref(average ,-7);
C2L = Cross(myArrayu ,myArrayd );

C1S= Histind < average ;// AND average >Ref(average ,-7);
C2S = Cross(myArrayd ,myArrayu );

Buy=C1L AND C2L ;
Sell=C2s;

Short=C1S AND C2S;
Cover=C2l;

ExRem(Buy,Sell);
ExRem(Short,Cover);

PlotShapes( Buy * shapeUpTriangle, colorBrightGreen, 0);
PlotShapes( Short * shapeDownTriangle, colorOrange, 0);
//PlotShapes( Sell * shapeHollowSmallCircle, colorRed, 0);
//PlotShapes( Cover * shapeSmallCircle, colorDarkGreen, 0,myarray,Offset=-25);

ApplyStop(stopTypeLoss, stopModePercent, Optimize( "stopTypeLoss", 2.5, 2.5, 2.5, 0.5 ) ,1, True );
//ApplyStop(stopTypeProfit , stopModePercent, Optimize( "stopTypeProfit ", 2.0, 2.5, 2.5, 0.1 ) ,2, True );

////////////////////////////// HIGHLY IMPORTANT ////////////////////
//LETOP: ACTIVATESTOPS MOET AANSTAAN IN SETTINGS
e = Equity(1,0);  /* Highly Important!!. "Removes all extra signals, evaluates
						stops AND writes BACK signals to Sell/Cover arrays". As it should be!!*/

Lprofit = e - ValueWhen( Buy, e);
Sprofit = e - ValueWhen( Short, e);

PlotShapes( Buy* shapeUpArrow , colorDarkGreen, 0);
PlotShapes( Short* shapeDownArrow , colorDarkRed, 0);

////////////////////////////////////////////////////////////////////////////////

_SECTION_BEGIN("Bollinger Bands");
P = ParamField("Price field",-1);
Periods = Param("Periods", 15, 2, 100, 1 );
Width = Param("Width", 2, 0, 10, 0.05 );
Color = ParamColor("Color", colorLightGrey );
Style = ParamStyle("Style", styleLine | styleNoLabel ) | styleNoLabel;
Plot( bbt = BBandTop( P, Periods, Width ), "BBTop" + _PARAM_VALUES(), Color, Style );
Plot( bbb = BBandBot( P, Periods, Width ), "BBBot" + _PARAM_VALUES(), Color, Style );
PlotOHLC( bbt, bbt, bbb, bbb, "", ColorBlend( Color, colorWhite, 0.9 ), styleNoLabel | styleCloud | styleNoRescale, Null, Null, Null, -1 );
_SECTION_END();
2 comments
Leave Comment
Please login here to leave a comment.
error in line 144
szgolyas, use latest amibroker version