Add custom lines to pricechart for Amibroker (AFL)
Dryden over 14 years ago Amibroker (AFL)
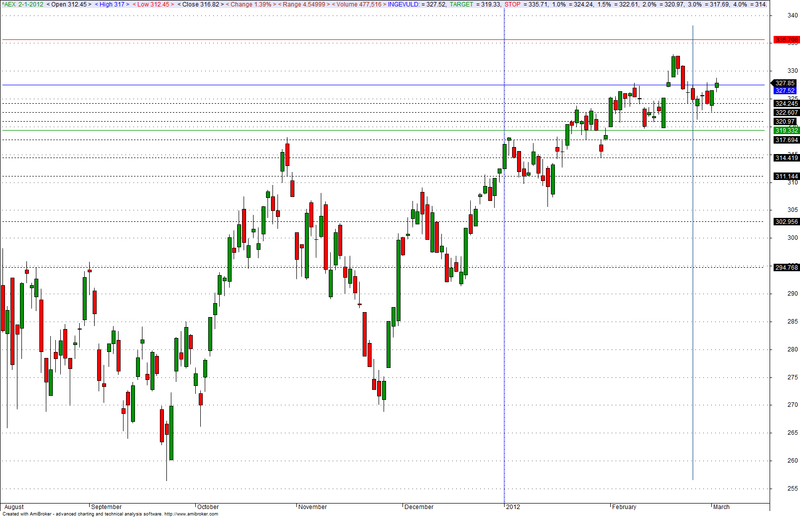
adds custom lines to a price chart.
in parameters, you can enter (it’s in dutch right now)
- the date after the signal
- the opening after signal
- show lines long yes/no
- show lines short yes/no
basically because it works eod, you get signal after the market closes. I always test systems, that they enter the market on the open on the next day. Because of these fixed lines, it’s easy to so how the trade goes.
One thing which bothers me though, and I’m unable to solve it, is that the horizontal lines are drawn to the left all they way. (and mess op the chart a bit)
I would prefer, that from the vertical line ( is the line which date is entered in the parameters) the lines are drawn say 10 bars to the left and of course all the way to the right.
If someone knows how to to this, help is much appreciated!
Screenshots
Indicator / Formula
_SECTION_BEGIN("__add custom lines to pricechart");

STOPLOSS = 2.5;
PROFIT = 2.5;
EPT1= 1.0;
EPT1a= 1.5;
EPT2= 2.0;
EPT3= 3.0;
EPT4= 4.0;

EPT5= 5.0;
EPT6= 7.5;
EPT7= 10.0;

line = DateNum() == ParamDate("VUL IN V/D DAG NA SIGNAAL: DATUM", "24/02/2012", 0); //plot vertical line

Value = Param( "VUL IN V/D DAG NA SIGNAAL: OPEN", 327.52,200,600,0.01 );

LinesLONG  = ParamToggle("Toon lijnen positie LONG ","No|Yes",0);
LinesSHORT = ParamToggle("Toon lijnen positie SHORT ","No|Yes",1);

if (LinesLONG  )
Plot(Value ,"INGEVULD:",colorBlue ,styleLine | styleThick, Null, Null, 10) AND
Plot(Value +((Value /100)*PROFIT)," TARGET ",colorGreen,styleLine | styleThick, Null, Null, 10) AND
Plot(Value -((Value /100)*STOPLOSS)," STOP ",colorRed,styleLine | styleThick, Null, Null, 10) AND
Plot(Value +((Value /100)*EPT1)," 1.0% ",colorBlack,styleLine|styleDashed, Null, Null, 10 ) AND
Plot(Value +((Value /100)*EPT1a)," 1.5% ",colorBlack,styleLine|styleDashed, Null, Null, 10 ) AND
Plot(Value +((Value /100)*EPT2)," 2.0% ",colorBlack,styleLine|styleDashed, Null, Null, 10 ) AND
Plot(Value +((Value /100)*EPT3)," 3.0% ",colorBlack,styleLine|styleDashed, Null, Null, 10 ) AND
Plot(Value +((Value /100)*EPT4)," 4.0% ",colorBlack,styleLine|styleDashed, Null, Null, 10 ) AND
Plot(Value +((Value /100)*EPT5)," 5.0% ",colorBlack,styleLine|styleDashed, Null, Null, 10 ) AND
Plot(Value +((Value /100)*EPT6)," 7.5% ",colorBlack,styleLine|styleDashed, Null, Null, 10 ) AND
Plot(Value +((Value /100)*EPT7)," 10.0% ",colorBlack,styleLine|styleDashed, Null, Null, 10 ) AND
Plot(line, "", colorLightBlue, styleHistogram | styleOwnScale | styleNoLabel | styleThick);

if (LinesSHORT )
Plot(Value ,"INGEVULD:",colorBlue ,styleLine | styleThick, Null, Null, 10) AND
Plot(Value -((Value /100)*PROFIT)," TARGET ",colorGreen,styleLine | styleThick, Null, Null, 10) AND
Plot(Value +((Value /100)*STOPLOSS)," STOP ",colorRed,styleLine | styleThick , Null, Null, 10) AND
Plot(Value -((Value /100)*EPT1)," 1.0% ",colorBlack,styleLine|styleDashed, Null, Null, 10 ) AND
Plot(Value -((Value /100)*EPT1a)," 1.5% ",colorBlack,styleLine|styleDashed, Null, Null, 10 ) AND
Plot(Value -((Value /100)*EPT2)," 2.0% ",colorBlack,styleLine|styleDashed, Null, Null, 10 ) AND
Plot(Value -((Value /100)*EPT3)," 3.0% ",colorBlack,styleLine|styleDashed, Null, Null, 10 ) AND
Plot(Value -((Value /100)*EPT4)," 4.0% ",colorBlack,styleLine|styleDashed, Null, Null, 10 ) AND
Plot(Value -((Value /100)*EPT5)," 5.0% ",colorBlack,styleLine|styleDashed, Null, Null, 10 ) AND
Plot(Value -((Value /100)*EPT6)," 7.5% ",colorBlack,styleLine|styleDashed, Null, Null, 10 ) AND
Plot(Value -((Value /100)*EPT7)," 10.0% ",colorBlack,styleLine|styleDashed, Null, Null, 10 ) AND
Plot(line, "", colorLightBlue, styleHistogram | styleOwnScale | styleNoLabel | styleThick);
_SECTION_END();
1 comments
Leave Comment
Please login here to leave a comment.
Hi, I have installed your code. It’s a great idea. What happens is that I need you to paint future lines on the right side of the chart to be able to paint the expiration days of options that are every month on the third Friday of the month. Also, let the vertical line paint the date of the candle. Can be?. Thank you