Bman's HaDiffCO for Amibroker (AFL)
kaiji over 16 years ago Amibroker (AFL)
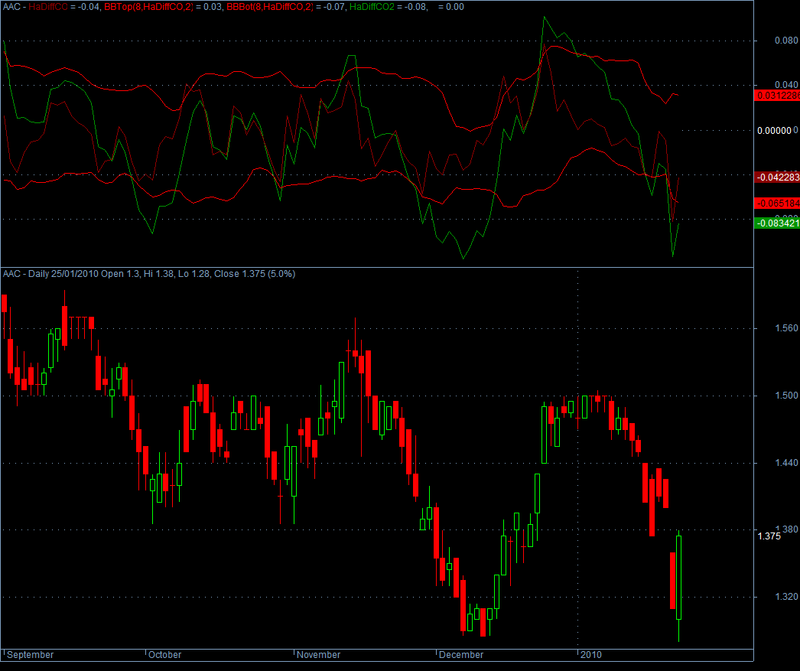
This is a modified version of the Heikin-Ashi HaDiffCO indicator. This modification gives interesting results which are still being examined. The best signals seem to come from weekly stock charts. Other investment products have not yet been thoroughly tested.
Please post any improvements to this code. Signal improvements are also welcome.
Buy signals (reverse these signals to go short):
1) Green line crosses above upper bollinger (red). Stronger signal if green line has departed from dark red line (which should be lower).
2) Green line crosses above lower bollinger (red). Stronger signal if green line has departed from dark red line (which should be higher).
3) Dark red and also green line cross above zero (0) line (black)
Reversal signals:
1) Dark red line and also green line “kiss” the upper bollinger (red). Both dark red and green line need to be nearly on top of each other for this signal to be clear.
2) Dark red line and also green line “kiss” the lower bollinger (red). Both dark red and green line need to be nearly on top of each other for this signal to be clear.
Trend signals (long-term buy and short signals):
1) Green line crossing above zero (0) line (black) indicates new uptrend. Stronger signal if dark red line is above zero.
2) Green line crossing below zero (0) line (black) indicates new downtrend. Stronger signal if dark red line is below zero.
Screenshots
Indicator / Formula
_SECTION_BEGIN("Bman's HaDiffCO");
// HaDiffCO modification made by Bman
// email: mail2br@gmail.com

/*
This is a modified version of the Heikin-Ashi HaDiffCO indicator.
This modification gives interesting results which are still being
examined. The best signals seem to come from weekly stock charts.
Other investment products have not yet been thoroughly tested.

Buy signals (reverse these signals to go short):
1) Green line crosses above upper bollinger (red). Stronger signal
if green line has departed from dark red line (which should be lower).

2) Green line crosses above lower bollinger (red). Stronger signal
if green line has departed from dark red line (which should be higher).

3) Dark red and also green line cross above zero (0) line (black)

Reversal signals:
1) Dark red line and also green line "kiss" the upper bollinger (red).
Both dark red and green line need to be nearly on top of each other for
this signal to be clear.

2) Dark red line and also green line "kiss" the lower bollinger (red).
Both dark red and green line need to be nearly on top of each other for
this signal to be clear.

Trend signals (long-term buy and short signals):
1) Green line crossing above zero (0) line (black) indicates new uptrend.
Stronger signal if dark red line is above zero.

2) Green line crossing below zero (0) line (black) indicates new downtrend.
Stronger signal if dark red line is below zero.
*/

HaClose=(O+H+L+C)/4;
HaOpen=AMA(Ref(HaClose,-1),0.5);
HaHigh=Max(H,Max(HaClose,HaOpen));
HaLow=Min(L,Min(HaClose,HaOpen));

HaDiffCO = (HaClose-HaOpen);
VarRedLine = WMA(HaDiffCO,5);
VarBlueLine = MA(HaDiffCO,8);
Per = Param("MA Periods",8,3,50,1);
Plot(HaDiffCO,"HaDiffCO",colorDarkRed);

P = ParamField("Price field",-1);
HDCPeriods = 15;
Width = Param("Width", 2, 0, 10, 0.05 );
Color = ParamColor("Color", colorCycle );
Style = ParamStyle("Style");
Plot( BBandTop( P, HDCPeriods, Width ), "BBTop" + _PARAM_VALUES(), Color, Style);
Plot( BBandBot( P, HDCPeriods, Width ), "BBBot" + _PARAM_VALUES(), Color, Style);

VarAMA = Param("varAMA",0.1,0,2,0.01);
HaClose2=(H+L+C)/3;
HaOpen2=AMA(Ref(HaClose2,-1),VarAMA);
HaHigh2=Max(H,Max(HaClose2,HaOpen2));
HaLow2=Min(L,Min(HaClose2,HaOpen2));
HaDiffCO2 = HaClose2-HaOpen2;

Plot(HaDiffCO2,"HaDiffCO2",colorGreen);
Plot(0,"0",colorBlack,styleDots);

_SECTION_END();
1 comments
Leave Comment
Please login here to leave a comment.
can you help how to use it in 5 min chart with examples