KILL THE OPERATOR MACD for Amibroker (AFL)
prasadmuni almost 14 years ago Amibroker (AFL)
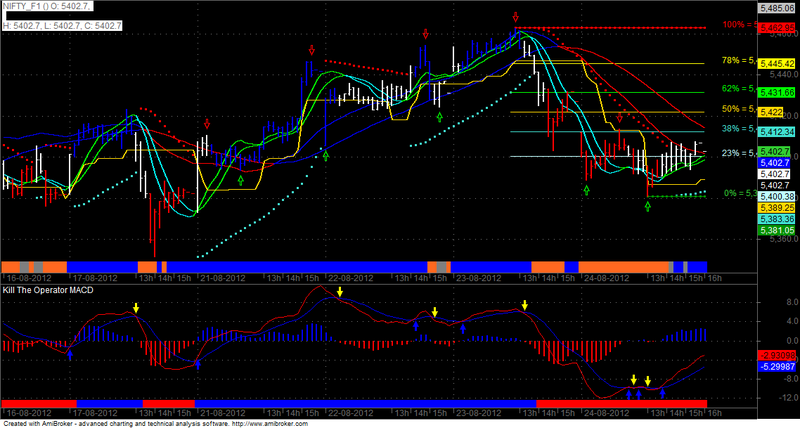
HI FRIENDS AS PER YOUR REQUEST I HAVE POSTED THE SOUGHT AFTER KILL THE OPERATOR MACD WITH TREND RIBBON AND BUY AND SELL SIGNALS WITH ALERTS.GOOD LUCK AND HAPPY TRADING.
PRASAD MUNI
Screenshots
Indicator / Formula
Copy & Paste Friendly
_SECTION_BEGIN("Kill The Operator MACD");
SetChartBkColor(ParamColor("Panel color ",colorBlack));
r1 = Param( "Fast avg", 12, 2, 200, 1 );
r2 = Param( "Slow avg", 26, 2, 200, 1 );
r3 = Param( "Signal avg", 9, 2, 200, 1 );
Plot( ml = MACD(r1, r2), StrFormat(_SECTION_NAME()+"(%g,%g)", r1, r2), ParamColor("MACD color", colorRed ), ParamStyle("MACD style") );
Plot( sl = Signal(r1,r2,r3), "Signal" + _PARAM_VALUES(), ParamColor("Signal color", colorBlue ), ParamStyle("Signal style") );
Histogram_color = IIf( ml-sl > 0, colorBlue, colorRed);
Plot( ml-sl, "MACD Histogram", Histogram_color, styleNoTitle | ParamStyle("Histogram style", styleHistogram | styleThick | styleNoLabel, maskHistogram ) );
Title = EncodeColor(colorWhite)+ "Kill The Operator MACD";
_SECTION_END();

x = ml;
y = sl;

Buy=Cross(x,y);
PlotShapes(shapeUpArrow*Buy,colorBlue);
Sell=Cross(y,x);
PlotShapes(shapeDownArrow*Sell,colorYellow);
AlertIf( Buy, "SOUND C:\\Windows\\Media\\notify.wav", "Audio alert", 2 );
AlertIf( Sell, "SOUND C:\\Windows\\Media\\chord.wav", "Audio alert", 2 );

/* Trend Filters */
TimeFrameSet(in15Minute);
SwingTrd151 = 100 * (Close - ((MA(C,2)+
MA(MA(C,2),2)+
MA(MA(MA(C,2),2),2) +
MA(MA(MA(MA(C,2),2),2),2) +
MA(MA(MA(MA(MA(C,2),2),2),2),2) +
MA(MA(MA(MA(MA(MA(C,2),2),2),2),2),2) +
MA(MA(MA(MA(MA(MA(MA(C,2),2),2),2),2),2),2)+
MA(MA(MA(MA(MA(MA(MA(MA(C,2),2),2),2),2),2),2),2)+
MA(MA(MA(MA(MA(MA(MA(MA(MA(C,2),2),2),2),2),2),2), 2),2)+
MA(MA(MA(MA(MA(MA(MA(MA(MA(MA(C,2),2),2),2),2),2), 2),2),2),2))
/10))/(HHV(C,10)-LLV(C,10));
SwingTrd152=EMA(SwingTrd151,13);
SwingTrd153=EMA(SwingTrd152,13);
RMO15= EMA(SwingTrd151,34);
Bull_Trend15=EMA(SwingTrd151,34)>0;
Bear_Trend15=EMA(SwingTrd151,34)<0;
TimeFrameRestore();
Ribbon_kol15=IIf(TimeFrameExpand(Bull_Trend15,in15Minute),colorBlue, IIf(TimeFrameExpand(Bear_Trend15,in15Minute),colorRed, colorBlack));
Plot(2, "ribbon", Ribbon_kol15, styleOwnScale|styleArea|styleNoLabel, -0.5,100);

TimeFrameSet(10*in1Minute);
SwingTrd101 = 100 * (Close - ((MA(C,2)+
MA(MA(C,2),2)+
MA(MA(MA(C,2),2),2) +
MA(MA(MA(MA(C,2),2),2),2) +
MA(MA(MA(MA(MA(C,2),2),2),2),2) +
MA(MA(MA(MA(MA(MA(C,2),2),2),2),2),2) +
MA(MA(MA(MA(MA(MA(MA(C,2),2),2),2),2),2),2)+
MA(MA(MA(MA(MA(MA(MA(MA(C,2),2),2),2),2),2),2),2)+
MA(MA(MA(MA(MA(MA(MA(MA(MA(C,2),2),2),2),2),2),2), 2),2)+
MA(MA(MA(MA(MA(MA(MA(MA(MA(MA(C,2),2),2),2),2),2), 2),2),2),2))
/10))/(HHV(C,10)-LLV(C,10));
SwingTrd102=
EMA(SwingTrd101,13);
SwingTrd103=EMA(SwingTrd102,13);
RMO10= EMA(SwingTrd101,34);
Bull_Trend10=EMA(SwingTrd101,34)>0;
Bear_Trend10=EMA(SwingTrd101,34)<0;
TimeFrameRestore();
Ribbon_kol10=IIf(TimeFrameExpand(Bull_Trend10,10*in1Minute),colorBlue, IIf(TimeFrameExpand(Bear_Trend10,10*in1Minute),colorRed, colorBlack));
Plot(4, "ribbon", Ribbon_kol10, styleOwnScale|styleArea|styleNoLabel, -0.5,100);


SwingTrd1 = 100 * (Close - ((MA(C,2)+
MA(MA(C,2),2)+
MA(MA(MA(C,2),2),2) +
MA(MA(MA(MA(C,2),2),2),2) +
MA(MA(MA(MA(MA(C,2),2),2),2),2) +
MA(MA(MA(MA(MA(MA(C,2),2),2),2),2),2) +
MA(MA(MA(MA(MA(MA(MA(C,2),2),2),2),2),2),2)+
MA(MA(MA(MA(MA(MA(MA(MA(C,2),2),2),2),2),2),2),2)+
MA(MA(MA(MA(MA(MA(MA(MA(MA(C,2),2),2),2),2),2),2), 2),2)+
MA(MA(MA(MA(MA(MA(MA(MA(MA(MA(C,2),2),2),2),2),2), 2),2),2),2))
/10))/(HHV(C,10)-LLV(C,10));
SwingTrd2=
EMA(SwingTrd1,13);
SwingTrd3=
EMA(SwingTrd2,13);
RMO= EMA(SwingTrd1,34);
Bull_Trend=EMA(SwingTrd1,34)>0;
Bear_Trend=EMA(SwingTrd1,34)<0;
Ribbon_kol=IIf(Bull_Trend,colorBlue, IIf(Bear_Trend,colorRed, colorBlack));
Plot(6, "ribbon", Ribbon_kol, styleOwnScale|styleArea|styleNoLabel, -0.5,100);
// End of Trend Filters
20 comments
Leave Comment
Please login here to leave a comment.
thnkss boss prasadmuni for “kill the operator MACD” but boss I cant understand the difference between the classical MACD and kill the operator..pls help me to understand .. thanks again..
Dear Prasad Muni
Thanks.
SIR OPEN THE 5 OR 15 MIN PRICE CHART AND PLACE THE MACD BELOW AND OBSERVE THE TRENDING RIBBON.BULLISH AND BEARISH TRENDS ARE CLEARLY DISTINGUISHED.THE MACD FORMULA REMAINS THE SAME CLASSIC AND THE RIBBON MAKES THE DIFFERENCE.
ANOTHER MACD FORMULA TO TRADE IN 5 MIN TIME ONLY IS GIVEN BELOW.THE TWO INDICATORS HAVE TO BE PLACED AND TRADED ON 5 MIN TIME FRAME.IF BOTH THE HISTOGRAMS ARE TRENDING IN THE SAME DIRECTION EITHER BEARISH OR BULLISH TAKE TRADE.GUARANTEED TRADE.
An Excellent Indicator.
Thx a lot.
May I, request you to add exact Buy and Sell arrow at the ribbon colour.
A scan will help us to find all the good trending stocks.
All the best
Thx again.
Brgds
RAvi
Dear Prasad Muni, lot of thanks for nice clarification…
hello sir nice to see kill the operator
but the second one u posted in comment is not working some variable ml used without having been initialized please fix it sir i will be helpfull
Mr Balamurugan this is the MACD 2 Indicator pl check and comment later.It has been fixed.
Hi,
Thank you for posting the afl..MACD2 afl still gives some error message. Please fix the error
Best,
Solo
hi
yes still it gives error
.
pl clarify u r sentence
ON 5 MIN TIME FRAME.IF BOTH THE HISTOGRAMS ARE TRENDING IN THE SAME DIRECTION EITHER BEARISH OR BULLISH TAKE TRADE.GUARANTEED TRADE.
ravi
Dear Prasad Muni,
Nice work…can you share the above price chart afl code….also explain how to use the indicator in detail…will be great to hear from you more on this…hope u answer asap…
Regards
HI BHAVIN
THE PRICE CHART YOU ARE ASKING FOR IS ALREADY POSTED BY ME PL LOOK FOR CROSS OVER BUY SELL VER 2 AND ALSO THE TRADING STRATEGY IS EXPLAINED THERE.HAPPY TRADING AND GOOD LUCK.
REGARDS
This indicator has same result as MACD PREDICTION afl here
Dear Prasad muni Sir,
plz mix the both cross over buy and sell and kill the operator
macd as above screen shot we are getting confuse plz mix both an
and share full formula as screen shot above plzzzzzzzzz
personaly requesting sir thanks in advance i hope waiting in positive result….
Dear sir muniprasad
thanks for sharing such a wonderful and useful afl but plz one request to share mix both cross over buy and sell and kill the operator macd as above screen shot
thanks in advance
price chart afl not present, no use
Thankyou for uploading…
really fantastic work sir
if we stick with the rules defiantly we can earn money from market
Thanks for such a good system
seems like the upper code is good one to get buy sell signal
can you post that as well
Good Afternoon Mr. Prasad
Tons of thanks for your hard work and continued support. I have just one query.
Can we use this for Day and Weekly chart for long term trade.
I appreciate your quick reply.
Regards
Hello there!
10 years past hope I still get some answer. May I know what i need to change to apply on to a daily chart.
Cheers and Best Regards