Buy Sell Stock for Amibroker (AFL)
ajeet over 14 years ago Amibroker (AFL)
Use 5 mins or higher time frame.
Trade in min of 4 stocks simultaneously(Fund Diversification is must).
Higher the time frame, higher the target.(i kept 1% for 5mins)
Keep SL @ 1% only.
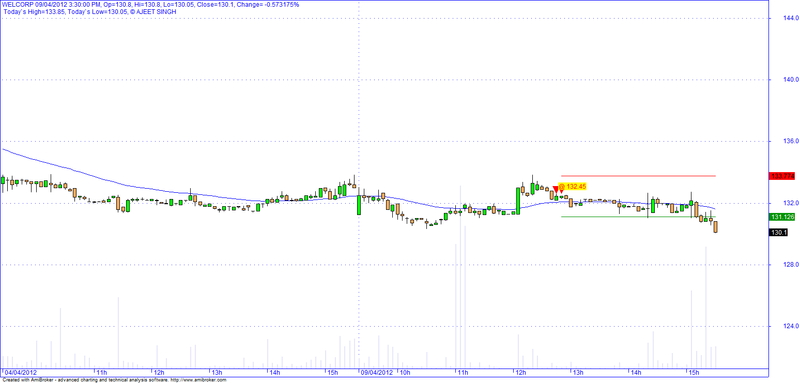
Screenshots
Indicator / Formula
Copy & Paste Friendly
// mr.ajeetsingh@yahoo.com
_SECTION_BEGIN("Price");
SetChartOptions(0,chartShowArrows|chartShowDates);
Plot( C, "Close", ParamColor("Color", colorBlack ), styleNoTitle | ParamStyle("Style") | GetPriceStyle() );
_SECTION_END();

TimeFrameSet(inDaily);
DayHigh = LastValue(H);
DayLow = LastValue(L);
TimeFrameRestore();

Title = Name() + " " + Date() + ", Op=" + Open + ", Hi=" + High + ", Lo=" + Low + ", Close=" + Close + ", Change= " + SelectedValue( ROC( C, 1 ) ) + "%" + "\n Today`s High=" + DayHigh + ", Today`s Low=" + DayLow + ", © AJEET SINGH" ;


_SECTION_BEGIN("Volume");
Plot( Volume, _DEFAULT_NAME(), ParamColor("Color", colorLavender ), styleNoTitle | ParamStyle( "Style", styleHistogram | styleOwnScale | styleThick | styleNoLabel, maskHistogram  ), 2 );
_SECTION_END();


_SECTION_BEGIN("EMA34");
P = ParamField("Price field",-1);
Plot( EMA( P, 34 ), _DEFAULT_NAME(), ParamColor( "Color", colorBlue ), ParamStyle("Style",styleLine|styleNoLabel) );
_SECTION_END();

_SECTION_BEGIN("Nifty_compare");
PlotForeign("NIFTY","NIFTY",ParamColor("Color", colorPink ), styleNoTitle | ParamStyle("Style", styleOwnScale | styleThick|styleNoLabel) );
_SECTION_END();

_SECTION_BEGIN("Nifty_compare1");
PlotForeign("^NSEI","NIFTY1",ParamColor("Color", colorPink ), styleNoTitle | ParamStyle("Style", styleOwnScale | styleThick|styleNoLabel) );
_SECTION_END();


_SECTION_BEGIN("Arrow_marks");
periods = Param( "Periods", 20, 1, 200, 1 );
Ksmooth = Param( "%K avg", 12, 1, 200, 1 );
DSmooth = Param( "%D avg", 10, 1, 200, 1 );

y0=LastValue(Trough(StochD(periods , Ksmooth, DSmooth ),1,2));
y1=LastValue(Trough(StochD(periods , Ksmooth, DSmooth ),1,1));
x0=BarCount - 1 - LastValue(TroughBars(StochD(periods , Ksmooth, DSmooth ),1,2));
price_start=Close[x0];
x1=BarCount - 1 - LastValue(TroughBars(StochD(periods , Ksmooth, DSmooth ),1,1));
price_end=Close[x1];
Line = LineArray( x0, y0, x1, y1, 0 );
Buy = y1>y0 AND price_end<price_start;
LastPointBuy = LineArray(x1-1,Close[x1-1],x1,Close[x1],0);
PlotShapes(shapeUpTriangle * Buy, colorGreen,0,LastPointBuy);
AlertIf(Buy,"","",1);

y00=LastValue(Peak(StochD(periods , Ksmooth, DSmooth ),1,2));
y11=LastValue(Peak(StochD(periods , Ksmooth, DSmooth ),1,1));
x00=BarCount - 1 - LastValue(PeakBars(StochD(periods , Ksmooth, DSmooth ),1,2));
price_start1=Close[x00];
x11=BarCount - 1 - LastValue(PeakBars(StochD(periods , Ksmooth, DSmooth ),1,1));
price_end1=Close[x11];
Line = LineArray( x00, y00, x11, y11, 0 );
LastPointSell = LineArray(x11-1,Close[x11-1],x11,Close[x11],0);
Sell = y11<y00 AND price_end1>price_start1;
PlotShapes(shapeDownTriangle * Sell, colorRed,0,LastPointSell);
AlertIf(Sell,"","",2);

dist = 0.8*ATR(10);
if( Buy )
  {
  PlotText( "\n@ " + Close[x1],x1, L[x1] - dist[x1], colorGreen ,colorYellow);
  targetValue = (Close[x1])*(1.01);
  stopValue = (Close[x1])*(0.99);

  LastBar = BarCount - 1 - LastValue(x1);
  target = LineArray(x1,targetValue, LastBar,targetValue,1,False);
  stop = LineArray(x1,stopValue, LastBar,stopValue,1,False);
  Plot(target,"BuyTgt",colorGreen,styleLine|styleThick);
  Plot(stop,"BuyStop",colorRed,styleLine|styleThick);
  }
if( Sell )
  {
  PlotText( "@ " + Close[x11],x11, H[x11] + dist[x11], colorRed ,colorYellow);
  targetValue = (Close[x11])*(0.99);
  stopValue = (Close[x11])*(1.01);
  LastBar = BarCount - 1 - LastValue(x11);
  target = LineArray(x11,targetValue, LastBar,targetValue,1,False);
  stop = LineArray(x11,stopValue, LastBar,stopValue,1,False);
  Plot(target,"SellTgt",colorGreen,styleLine|styleThick);
  Plot(stop,"SellStop",colorRed,styleLine|styleThick);
  }
_SECTION_END();
5 comments
Leave Comment
Please login here to leave a comment.
Tested so far only on NSEstocks.
not working
Working well on amibroker 5.30
Signals are rare….. so you need atleast 20-30 scrips only then you will see signal in 1 scrip.
past signals are auto erased.
y erase past signals?any reason for that?wont the signals remaining there help in back testing? #just asking :)
Hay quá. Thanks you