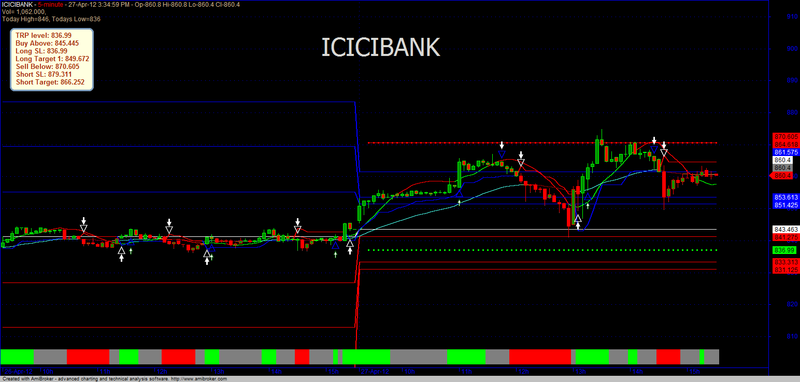
Buy Sell Nifty ver 2 for Amibroker (AFL)
ajeet about 14 years ago Amibroker (AFL)
Can be used for liquid indian stocks or nifty.(NSEINDIA.COM)
I tested on 5 mins and 15 mins graph.
some levels have been added to prev. version
Screenshots
Indicator / Formula
Copy & Paste Friendly
//mr.ajeetsingh@yahoo.com
_SECTION_BEGIN("MA Diff");
T=26;
KMA=((C-MA(C,T))/MA(C,T))*100;
Graph0=KMA;
Graph0Style=2+4;
Graph0BarColor=IIf(KMA>0,5,4);
GraphXSpace=5;

_SECTION_END();

_SECTION_BEGIN("Price");
SetChartOptions(0,chartShowArrows|chartShowDates);
Plot( C, "Close", ParamColor("Color", colorBlack ), styleNoTitle | ParamStyle("Style") | GetPriceStyle() );
_SECTION_END();

//------------------------------------------------------------------------------

_SECTION_BEGIN("ZIG-ZAG");
P = ParamField( "Price field" );
change = Param("% change",5,0.1,25,0.1);
_SECTION_END();

_SECTION_BEGIN("EMA");
P = ParamField("Price field",-1);
Periods = Param("Periods", 15, 2, 300, 1, 10 );
_SECTION_END();

_SECTION_BEGIN("MACD Exploration");
r1 = Param( "Fast avg", 12, 2, 200, 1 );
r2 = Param( "Slow avg", 26, 2, 200, 1 );
r3 = Param( "Signal avg", 9, 2, 200, 1 );
Z=Param("zig",1,0,10,0.1);


Cond1 = Cross(MACD(r1,r2),Signal(r1,r2,r3));

Cond3 = Zig(C,z)>Ref(Zig(C,z),-4);
Buy = Cond1 AND Cond3;

Cond4 = Cross(Signal(r1,r2,r3),MACD(r1,r2));

Cond6 = Zig(C,z)<Ref(Zig(C,z),-4);
Sell = Cond4 AND Cond6;
Trigger = WriteIf(Buy, "Buy", "") + WriteIf(Sell, "Sell", "");

_N(Title = StrFormat("{{NAME}} {{DATE}} {{INTERVAL}}: O=%1.2f, H=%1.2f, L=%1.2f, C=%1.2f, V=%1.0f\n{{VALUES}}", O, H, L, C, V));

BG = IIf(Buy, colorPaleGreen, IIf(Sell, colorRose, colorDefault));
FG = IIf(Buy, colorDarkGreen, IIf(Sell, colorDarkRed, colorDefault));

if(Status("action") == actionIndicator)
{
Plot(C, "", colorGrey50, styleBar);
PlotShapes(IIf(Buy, shapeUpArrow, shapeNone),colorWhite, 0,L, Offset=-30);
PlotShapes(IIf(Sell, shapeDownArrow, shapeNone),colorWhite, 0,H, Offset=-30);

}

//------------------------------------------------------------------------------------------------
if(Status("action") == actionExplore)

Filter = Buy OR Sell;
SetOption("NoDefaultColumns", True);

AddTextColumn(Name(), "Symbol", 77, FG, BG, 120);
AddColumn(DateTime(), "Date", formatDateTime, FG, BG, 100);
AddColumn(TimeNum() ,"Time",1);
AddColumn( C, "Close", 1.3 );
AddColumn( H, "High", 1.3 );
AddColumn(V, "Volume");
AddColumn(Ref(V,-1),"P-Vol");
AddColumn(V/Ref(V,-1)*100,"Increase in Vol");
AddColumn( Buy, "Buy", 1 );
AddColumn( Sell, "Sell", 1 );

shape = Buy * shapeHollowUpTriangle + Sell * shapeHollowDownTriangle;

PlotShapes( shape, IIf( Buy, colorBlue, colorBlue ), 0, IIf( Buy, Low, High ) );

GraphXSpace = 7;

GraphXSpace = 7;
_SECTION_END();

_SECTION_BEGIN("EMA3");
P = ParamField("Price field",-1);
Periods = Param("Periods", 15, 2, 300, 1, 10 );
_SECTION_END();


_SECTION_BEGIN("Background text");
C13=Param("fonts",20,10,30,1 );
C14=Param("left-right",2.1,1.0,5.0,0.1 );
C15=Param("up-down",12,1,20,1 );
Miny = Status("axisminy");
Maxy = Status("axismaxy");
lvb = Status("lastvisiblebar");
fvb = Status("firstvisiblebar");
pxwidth = Status("pxwidth");
pxheight = Status("pxheight");
GfxSetBkMode(transparent=1);
GfxSetOverlayMode(1);
GfxSelectFont("Tahoma", Status("pxheight")/C13 );
GfxSetTextAlign( 6 );
GfxSetTextColor( ColorRGB (217,217,213));
GfxTextOut( Name(), Status("pxwidth")/C14, Status("pxheight")/C15 );
GfxSelectFont("Tahoma", Status("pxheight")/C13*0.5 );
GfxSetTextColor( ColorRGB (103,103,103));
GfxTextOut( "", Status("pxwidth")/C14, Status("pxheight")/C15*2.5 );
GfxSelectFont("Tahoma", Status("pxheight")/C13*0.5 );
GfxSetTextColor( ColorRGB (103,103,103));
GfxTextOut( " ", Status("pxwidth")/C14, Status("pxheight")/C15*4 );
GfxSelectFont("MS Sans Serif", 10, 500, False, False, 0);
//Second phase starts Here
//File: BHS Chart
_SECTION_BEGIN("Trade");
SetChartBkColor(ParamColor("Outer panel color ",colorLightYellow));
SetChartBkColor(ParamColor("BackGround Color", colorBlack));
pShowtradeLines = ParamToggle("Show Trade Lines", "No|Yes", 1);
pShowMarkers = ParamToggle("Show Markers", "No|Yes", 1);
synch=ParamToggle("Synchronize buy/short with foreign index", "No|Yes", 1);
Volmin=Param("Volume minimum",5000,0,10000000,50);
Volmax=Param("Volume maximum",1000000,0,10000000,50);
priceRL=Param("Price Range Min",150,1,20000,1);
priceRH=Param("Price Range Max",3000,1,20000,1);
PercChangemin=Param("Percentage Change Min set", -25, -100, 100, 0.1);
PercChangemax=Param("Percentage Change Max set", 25, -100, 100, 0.1);
PerctakeProfit=Param("Take Profit Percent Set",0.5,0.3,30,0.1);
PercStoploss=Param("StopLoss Percent Set",1,0.2,5,0.1);

PlotOHLC(Open,High,Low,Close,"",colorWhite,styleCandle);
Bars = 0;
xpdh = 90;

{
Plot_Range = (TimeNum() >= 85500 AND TimeNum()<= 153500) AND (DateNum()==LastValue(DateNum()));
FH_Range = (TimeNum() >= 085500 AND TimeNum()<= 093000) AND (DateNum()==LastValue(DateNum()));

FH_Prices = High * FH_Range;
FH_Marker = BarsSince(FH_Range>0);

Num_Bars = 36000 / Interval(1);

TimeFrameSet(inDaily);
TOP_ = Open;
PDH_ = Ref(High,-1);
PDL_ = Ref(Low,-1);
PDO_ = Ref(Open,-1);
PDC_ = Ref(Close,-1);
PDM_ = (PDH_+PDL_)/2;
TimeFrameRestore();

isAll = True;
isRth = TimeNum() >= 085400 AND TimeNum() <= 093000;
isdRth = TimeNum() >= 085400 AND TimeNum() <= 160000;

aRthL = IIf(isRth, L, 1000000);
aRthH = IIf(isdRth, H, Null);
aRthLd = IIf(isdRth, L, 1000000);

TOP = TimeFrameExpand(TOP_,inDaily,expandFirst);
PDH = TimeFrameExpand(PDH_,inDaily,expandFirst);
PDL = TimeFrameExpand(PDL_,inDaily,expandFirst);
PDO = TimeFrameExpand(PDO_,inDaily,expandFirst);
PDC = TimeFrameExpand(PDC_,inDaily,expandFirst);
PDM = TimeFrameExpand(PDM_,inDaily,expandFirst);
FHH = Ref(HHV(High*FH_Range,Num_Bars),-FH_Marker);
FHL = TimeFrameCompress( aRthL, inDaily, compressLow );
FHL = TimeFrameExpand( FHL, inDaily, expandFirst );
DayH = TimeFrameCompress( aRthH, inDaily, compressHigh );
DayH = TimeFrameExpand( DayH, inDaily, expandFirst );
DayL = TimeFrameCompress( aRthLd, inDaily, compressLow );
DayL = TimeFrameExpand( DayL, inDaily, expandFirst );


FC1=((PDH-PDL)*0.433);
FC2=((PDH-PDL)*0.7666);
FC3=((PDH-PDL)*1.355);
FC4=(FHH-FHL);

A=IIf((FC4<=FC1+PDH*0.005),FC1,0);
B=IIf((FC4<=FC2+PDH*0.005 AND FC4>FC1+PDH*0.005),FC2,0);
Cl=IIf((FC4<=FC3 AND FC4>FC2+PDH*0.005),FC3,0);
AF=(A+B+Cl);

//foreign
_SECTION_BEGIN ("foreign Index bar graph");
Vr=ParamList("Index",List = "^NSEI,^NSEBANK,^CNXIT,^NSMIDCP,RELIANCE.NS,SB IN.N S",0);
SetForeign(Vr);
HaC =(O+H+L+C)/4;
HaO = AMA( Ref( HaC, -1 ), 0.5 );
HaH = Max( H, Max( HaC, HaO) );
HaL = Min( L, Min( HaC, HaO) );
BG3=HHV(LLV(HaL,4)+ATR(4),8);
BR3=LLV(HHV(HaH ,4)-ATR(4),8);
co = IIf(Hac>BG3 ,colorBrightGreen,IIf(Hac < BR3,colorRed,colorGrey50));
Plot(4, "", Co,styleArea+styleOwnScale | styleNoLabel, -1, 100);
RestorePriceArrays();
_SECTION_END();

BuyPrice=(DayL+AF);
BuyTP1=(BuyPrice+(BuyPrice*(PerctakeProfit/100)));
BuyTP2=(C>=BuyTP1);
SellPrice=(DayH-AF);
SellTP1=(SellPrice-(SellPrice*(PerctakeProfit/100)));
SellTP2=(C<=SellTP1);
percchange=(((C-TOP)/TOP)*100);
Vol=(V>=Volmin AND V<=Volmax);
Percentage=(percchange>=PercChangemin AND percchange<=PercChangemax);
prc=(C>=priceRL AND C<=priceRH);
BuyStop1=(BuyPrice-(BuyPrice*(PercStoploss/100)));
BuyStop2=IIf((BuyStop1<=SellPrice) AND SellPrice<=BuyPrice,SellPrice,BuyStop1);
SellStop1=(SellPrice+(SellPrice*(PercStoploss/100)));
SellStop2=IIf((SellStop1>=BuyPrice) AND SellPrice<=BuyPrice, BuyPrice,SellStop1);

BuyStop=IIf((Buy AND NOT BuyTP2),BuyStop2,Null);
BuyTP=IIf(Buy AND NOT BuyStop,BuyTP2,Null);

Bars = BarsSince(TimeNum() >= 85400 AND TimeNum() < 092900);
x0 = BarCount-LastValue(Bars);
x1 = BarCount-1;
TOP_Line = LineArray(x0,LastValue(TOP),x1,LastValue(TOP),0);
PDH_Line = LineArray(x0,LastValue(PDH),x1,LastValue(PDH),0);
PDL_Line = LineArray(x0,LastValue(PDL),x1,LastValue(PDL),0);
PDC_Line = LineArray(x0,LastValue(PDC),x1,LastValue(PDC),0);
PDM_Line = LineArray(x0,LastValue(PDM),x1,LastValue(PDM),0);
FHH_Line = LineArray(x0,LastValue(FHH),x1,LastValue(FHH),0);
FHL_Line = LineArray(x0,LastValue(FHL),x1,LastValue(FHL),0);
BuyPriceline=LineArray(x0,LastValue(BuyPrice),x1,LastValue(BuyPrice),0);
BuyStopline=LineArray(x0,LastValue(BuyStop2),x1,LastValue(BuyStop2),0);
BuyTPline=LineArray(x0,LastValue(BuyTP1),x1,LastValue(BuyTP1),0);
SellPriceline=LineArray(x0,LastValue(SellPrice),x1 ,LastValue(SellPrice),0);
SellStopline=LineArray(x0,LastValue(SellStop2),x1, LastValue(SellStop2),0);
SellTPline=LineArray(x0,LastValue(SellTP1),x1,LastValue(SellTP1),0);
DayHline=LineArray(x0,LastValue(DayH),x1,LastValue (DayH),0);
DayLline=LineArray(x0,LastValue(DayL),x1,LastValue (DayL),0);


Plot(IIf(pShowtradeLines,BuyStopline,Null),"BuySto p",colorBrightGreen,styleDots|styleNoRescale| styleNoLine);
Plot(IIf(pShowtradeLines,SellPriceline,Null),"Shor t Here",colorRed,styleDots|styleNoRescale);
PlotShapes(IIf(pShowMarkers AND Buy, shapeHollowUpArrow, Null), colorDarkGreen, 0,L,Offset=-30);

if( Status("action") == actionIndicator )
(
Title = EncodeColor(colorWhite)+ "Trading System" + " - " + Name() + " - " + EncodeColor(colorYellow)+ Interval(2) + EncodeColor(colorYellow) +
" - " + Date() +" - "+ EncodeColor(colorYellow) + "-Open="+WriteVal(O,1) + EncodeColor(colorYellow) + "- High= "+ WriteVal(H,1)+ EncodeColor(colorYellow) + "- Close= "+ WriteVal(C,1)+ EncodeColor(colorYellow) + "- Vol= "+ WriteVal(V,1)+ WriteIf(Percchange, " % Change = "+(Percchange)+" ","")+("\n")+
" Previous DayHigh="+WriteVal(PDH,1)+", Previous DayLow="+WriteVal(PDL,1)+", Today High="+WriteVal(DayH,1)+", Todays Low="+WriteVal(DayL,1)+
Comm2=("\n "+Vr+" Phase: ")+
WriteIf(Hac>BG3,EncodeColor(colorBrightGreen)+"+Up ",
WriteIf(Hac<BR3,EncodeColor(colorRed)+"-Down",EncodeColor(colorLightYellow)+"< Flat >")));

GfxSetOverlayMode( mode = 0 );
GfxSelectPen( colorLightBlue, 3 );
GfxSelectSolidBrush( colorLightYellow );
GfxRoundRect( 20, 55, 180, 175, 15, 15 );
GfxSetBkMode(1);
GfxSelectFont( "Arial", 10, 700, False );
GfxSetTextColor( colorBrown );
GfxSetTextAlign(0);
GfxTextOut( WriteIf(Buystop2, "TRP level: "+(Buystop2),""), 30, 60);
GfxTextOut( WriteIf(BuyPrice, "Buy Above: "+(BuyPrice),""), 30, 75);
GfxTextOut( WriteIf(BuyStop2, "Long SL: "+(BuyStop2),""), 30, 90);
GfxTextOut( WriteIf(BuyTP1 , "Long Target 1: "+(BuyTP1),""), 30, 105);
GfxTextOut( WriteIf(SellPrice, "Sell Below: "+(SellPrice),""), 30, 120);
GfxTextOut( WriteIf(SellStop2, "Short SL: "+(SellStop2),""), 30, 135);
GfxTextOut( WriteIf(SellTP1, "Short Target: "+(SellTP1),""), 30, 150);

AddColumn(V,"Volume",1.0);
AddColumn(Percchange,"Change %",1.2);
AddColumn(BuyPrice,"Buy at",1.2);
AddColumn(BuyStop,"Buy Stop at",1.2);
AddColumn(BuyTP1,"Buy Profit at",1.2);
AddColumn(SellPrice,"Short at",1.2);
AddColumn(SellTP1,"Short profit at",1.2);

}

_SECTION_END();

_SECTION_BEGIN("short signal");
HaClose=(O+H+L+C)/4;
HaOpen = AMA( Ref( HaClose, -1 ), 0.5 );
HaHigh = Max( H, Max( HaClose, HaOpen ) );
HaLow = Min( L, Min( HaClose, HaOpen ) );
BG2=HHV(LLV(Low,4)+ATR(4),8);
BR2=LLV(HHV(High,4)-ATR(4),8);
SetBarFillColor( IIf(O <C, colorSeaGreen,colorOrange) );
k = Optimize("K",Param("K",1.75,1,5,0.25),1,5,0.25);
Per= Optimize("atr",Param("atr",10,3,30,1),3,30,1);
j=HaClose;
nm= (H-L);
rfsctor = WMA(nm, PER);
revers = K * rfsctor;
Trend = 1;
NW[0] = 0;
for(i = 1; i < BarCount; i++)
{
if(Trend[i-1] == 1)
{
if(j[i] < NW[i-1])
{
Trend[i] = -1;
NW[i] = j[i] + Revers[i];
}
else
{
Trend[i] = 1;
if((j[i] - Revers[i]) > NW[i-1])
{
NW[i] = j[i] - Revers[i];
}
else
{
NW[i] = NW[i-1];
}
}
}
if(Trend[i-1] == -1)
{
if(j[i] > NW[i-1])
{
Trend[i] = 1;
NW[i] = j[i] - Revers[i];
}
else
{
Trend[i] = -1;
if((j[i] + Revers[i]) < NW[i-1])
{
NW[i] = j[i] + Revers[i];
}
else
{
NW[i] = NW[i-1];
}
}
}
}

Plot(NW, "", IIf(Trend == 1, 6, 4), 4);

Buy=Cross(j,nw);
Short=Cross(nw,j);
Sell=Cross(nw,j);
Cover=Cross(j,nw);
Buy=ExRem(Buy,Sell);
Sell=ExRem(Sell,Buy);
Short=ExRem(Short,Cover);
Cover=ExRem(Cover,Short);
PlotShapes(IIf(Buy, shapeUpArrow, shapeNone),colorWhite, 0,halow,-30);
PlotShapes(IIf(Sell, shapeHollowDownTriangle, shapeNone),colorWhite, 0,hahigh,-15);
PlotShapes(IIf(Cover, shapeHollowUpTriangle, shapeNone),colorWhite, 0,halow,-15);
PlotShapes(IIf(Short, shapeDownArrow, shapeNone),colorWhite, 0,hahigh,-30);
//-----------end--------------

//ADDED PIVOTS LINES LATER

//---- pivot points
DayH = TimeFrameGetPrice("H", inDaily, -1);// yesterdays high
DayL = TimeFrameGetPrice("L", inDaily, -1);//low
DayC = TimeFrameGetPrice("C", inDaily, -1);//close
DayO = TimeFrameGetPrice("O", inDaily);// current day open
HiDay = TimeFrameGetPrice("H", inDaily);
LoDay = TimeFrameGetPrice("L", inDaily);
PP = (DayH + DayL + DayO + DayO) / 4 ;
R1 = (2 * PP) - DayL;
S1 = (2 * PP) - DayH;
R2 = PP + R1 - S1;
S2 = PP + S1 - R1;
R3 = R2 + (R1 - PP);
S3 = S2 - (PP - S1);
style = styleLine | styleThick + styleNoRescale;
rcolor = colorBlue;
scolor = colorRed;
pcolor = colorWhite;
Plot(R1, "R1",rcolor,style);
Plot(S1, "S1",scolor,style);
Plot(R2, "R2",rcolor,style);
Plot(S2, "S2",scolor,style);
Plot(PP, "PP",pcolor,style);
Plot(s3, "S3", scolor, style);
Plot(R3, "R3", rcolor, style);
RangeTitle = EncodeColor(colorWhite) + "Day Range= " + EncodeColor(colorWhite);


// added later

////////////////////////////////////
// CCI Price Panel For Amibroker
// Coded by Crasher_FL
// Modified by Dennis
///////////////////////////////
// Tic/PIP values: YM=1.0, ER2=0.10, NQ=0.25, EUR/USD=.0001, USD/JPY=0.01, Stocks=0.01
///////////////////////////////

// Background color
//SetChartBkColor(ParamColor("Panel color ",colorPaleBlue));

TicDiv= Param("Tic or PIP value",1,0,1000000);
Titledisplay= ParamToggle("Display pivot stats","No|Yes",1);

//barcolor = IIf(C > Open, colorWhite, IIf(C == Open, colorWhite, colorWhite));
//Plot( C, "Close", barcolor,styleCandle | styleNoLabel);

EMA34 = EMA(C,34);
LSMA = LinearReg(C,25);
PI = atan(1.00) * 4;
periods = 30;
HighHigh = HHV(H, periods);
LowLow = LLV(L, periods);
range = 25 / (HighHigh - LowLow) * LowLow;
x1_EMA34 = 0;
x2_EMA34 = 2;
y1_EMA34 = 0;
y2_EMA34 = (Ref(EMA34, -2) - EMA34) / Avg * range;
c_EMA34 = sqrt((x2_EMA34 - x1_EMA34)*(x2_EMA34 - x1_EMA34) + (y2_EMA34 -
y1_EMA34)*(y2_EMA34 - y1_EMA34));
angle_EMA34 = round(180 * acos((x2_EMA34 - x1_EMA34)/c_EMA34) / PI);
TitleAngleEMA34 = EncodeColor(colorWhite) + "\nEMA34 angle = ";
angle_EMA34 = IIf(y2_EMA34 > 0, - angle_EMA34, angle_EMA34);
ColorANGLE_EMA = IIf(angle_EMA34 >=5,colorTurquoise,
IIf(angle_EMA34 <5 AND angle_EMA34 >=3.57,colorDarkGreen,
IIf(angle_EMA34 <3.57 AND angle_EMA34 >=2.14,colorPaleGreen,
IIf(angle_EMA34 <2.14 AND angle_EMA34 >=.71,colorLime,
IIf(angle_EMA34 <=-1*5,colorDarkRed,
IIf(angle_EMA34 >-1*5 AND angle_EMA34 <=-1*3.57,colorRed,
IIf(angle_EMA34 >-1*3.57 AND angle_EMA34 <=-1*2.14,colorOrange,
IIf(angle_EMA34 >-1*2.14 AND angle_EMA34 <=-1*.71,colorLightOrange,colorYellow))))))));
Plot(EMA34,"EMA 34",ColorANGLE_EMA, styleLine | styleThick | styleNoLabel );
Plot(lsma,"LSMA 25",IIf(C > lsma,colorBrightGreen,
IIf(C == lsma,colorTeal,colorRed)), styleLine | styleThick |styleNoLabel);


/*Gann HiLo*/

Hld = IIf(C > Ref(MA(H, 7), -1), 1, IIf(C < Ref(MA(L, 7), -1), -1, 0));
Hlv = ValueWhen(Hld != 0, Hld, 1);
Hilo = IIf(Hlv == -1, MA(H, 7), MA(L, 7));
Trigger = IIf(C>Hilo, colorBlue, colorPink);
//Plot(Hilo,"HiLo",Trigger,styleStaircase);


Title = EncodeColor(colorWhite)+ Name() + " - " + EncodeColor(colorRed)+ Interval(2) + EncodeColor(colorTan) +
" - " + Date() +" - "+"Op-"+O+" "+"Hi-"+H+" "+"Lo-"+L+" "+ "Cl-"+C+" "+ "\n"+ "Vol= "+ WriteVal(V)+",
Today High="+WriteVal(DayH,2)+", Todays Low="+WriteVal(DayL,2);
2 comments
Leave Comment
Please login here to leave a comment.
hey a nice systems seems to be can u explain in details the system. thanks in advance
can you please explain how to use and some indicators on this charts
thanks