Trend Follower for Amibroker (AFL)
ronnychat about 14 years ago Amibroker (AFL)
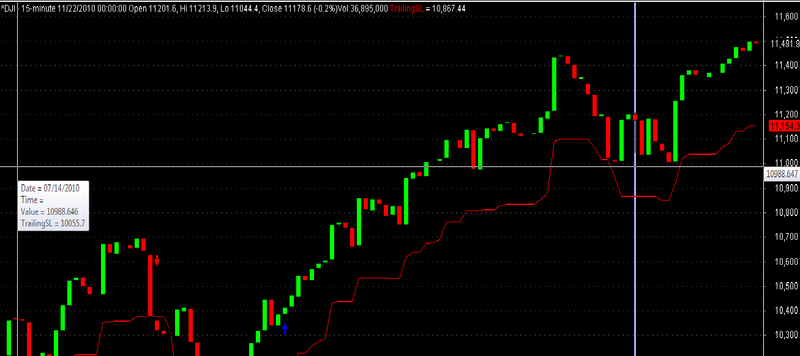
Its basically a trend follower, give buy sell signal according to trend, whether short erm or log term,
it works on higher high lower low basis
Screenshots
Indicator / Formula
Copy & Paste Friendly
//PRICE
_SECTION_BEGIN("Price");
//SetChartOptions(0,chartShowArrows|chartShowDates);
_N(Title = StrFormat("{{NAME}} - {{INTERVAL}} {{DATE}} Open %g, Hi %g, Lo %g, Close %g (%.1f%%)Vol " +WriteVal( V, 1.0 ) +
           " {{VALUES}}", O, H, L, C, SelectedValue( ROC( C, 1 )) ));
Plot( C, "", ParamColor("Color", colorBlack ), styleNoTitle | ParamStyle("Style") | GetPriceStyle() );
_SECTION_END();
//xxxxxxxxxxxxxxxxxxxxxxxxxxxxxxxxxxxxxxxxxxxxxxxxxxxxxxxxxxxxxxxxxxxxxxxxxxxxxxxxxxxxxxxxxxxxxxxxxxxxxxxxxxxxxxxxxxxx

//TRENDING RIBBON
// Paste the code below to your price chart somewhere and green ribbon means both
// both MACD and ADX trending up so if the red ribbon shows up the MACD and the ADX
// are both trending down.
_SECTION_BEGIN("trending ribbon");
uptrend=PDI()>MDI() AND MACD()>Signal();
downtrend=MDI()>PDI() AND Signal()>MACD();
Plot( 2, /* defines the height of the ribbon in percent of pane width */"",
    IIf( uptrend AND EMA(C,50)>=Ref(EMA(C,50),-1), colorLime, IIf( downtrend OR EMA(C,50)<Ref(EMA(C,50),-1),
     colorRed, colorTan)) , /* choose color */styleOwnScale|styleArea|styleNoLabel, -0.5, 100 );
_SECTION_END();
//xxxxxxxxxxxxxxxxxxxxxxxxxxxxxxxxxxxxxxxxxxxxxxxxxxxxxxxxxxxxxxxxxxxxxxxxxxxxxxxxxxxxxxxxxxxxxxxxxxxxxxxxx

//HEIKIN-ASHI
//SetChartOptions(0,chartShowArrows | chartShowDates);
HaClose = (O + H + L + C)/4;
HaOpen = AMA( Ref( HaClose, -1 ), 0.5 );
HaHigh = Max( H, Max( HaClose, HaOpen ) );
HaLow = Min( L, Min( HaClose, HaOpen ) );
xDiff = (HaHigh - Halow) * 10000;
//barcolor = IIf(HaClose >= HaOpen,colorGreen,colorRed);
barcolor= IIf(HaClose>=HaOpen,colorGreen,colorRed) ;
//SetBarFillColor(IIf(HaClose>=HaOpen,colorBrightGreen,colorOrange));
//PlotOHLC( HaOpen, HaHigh, HaLow, HaClose, "HA", barcolor, styleCandle );
HaDelta= (HaClose-HaOpen) ;
MAhadelta= MA(Hadelta,3) ;
Hadeltaupmahadelta = Hadelta>MAhadelta ;
cphadelta = hadelta>0 AND hadelta>MAhadelta ;
vdhadelta = hadelta<MAhadelta  ;
//xxxxxxxxxxxxxxxxxxxxxxxxxxxxxxxxxxxxxxxxxxxxxxxxxxxxxxxxxxxxxxxxxxxxxxxxxxxxxxxxxxxxxxxxxxxxxxx

//TRENDADVISOR

pointer[0] = 0;

/* Phase filter */

Cond1 = Close > MA(Close, 50)AND NOT(Close > MA(Close, 200))AND NOT(MA(Close, 50) > MA(Close, 200));
Cond2 = Close > MA(Close, 50)AND Close > MA(Close, 200)AND NOT(MA(Close, 50) > MA(Close, 200));
Cond3 = Close > MA(Close, 50)AND Close > MA(Close, 200)AND MA(Close, 50) > MA(Close, 200);
Cond4 = NOT(Close > MA(Close, 50))AND Close > MA(Close, 200)AND MA(Close, 50) > MA(Close, 200);
Cond5 = NOT(Close > MA(Close, 50))AND NOT(Close > MA(Close, 200))AND MA(Close, 50) > MA(Close, 200);
Cond6 = NOT(Close > MA(Close, 50))AND NOT(Close > MA(Close, 200))AND NOT(MA(Close, 50) > MA(Close, 200));

for (i = 1; i < BarCount; i++)
{

  if (Cond1[i])
    pointer[i] = 1;
  if (Cond2[i])
    pointer[i] = 2;
  if (Cond3[i])
    pointer[i] = 3;
  if (Cond4[i])
    pointer[i] = 4;
  if (Cond5[i])
    pointer[i] = 5;
  if (Cond6[i])
    pointer[i] = 6;

}

/* Plot Graphic */
//GraphXSpace= 15 ;
dynamic_color = IIf(pointer < 4, colorGreen, colorRed);
//Plot(pointer, "TrendAdv2", dynamic_color, styleHistogram | styleThick, Null, Null, 0);
//SetChartBkGradientFill(ParamColor("BgTop", colorWhite), ParamColor("BgBottom", colorLightYellow));
//xxxxxxxxxxxxxxxxxxxxxxxxxxxxxxxxxxxxxxxxxxxxxxxxxxxxxxxxxxxxxxxxxxxxxxxxxxxxxxxxxxxxxxxxxxxxxxxxxxxxxxxxxxx


//STOP LOSS
//The formula draws a stoploss loss line which will be 2% below the Highest Close within a lookback period of 5 bars.
//You can change these parameters.

lookbackPeriod = Param("Lookback period", 5, 1, 30);
stoplossPercentage = Param("Stoploss Percentage", 3, 2, 10);
TrailingSL= HHV(C,lookbackPeriod) - HHV(C,lookbackPeriod) * (stoplossPercentage / 100) ;
//Plot(HHV(C,lookbackPeriod) - HHV(C,lookbackPeriod) * (stoplossPercentage / 100), "TrailingSL", ParamColor( "Color", colorCycle ));
Plot(TrailingSL, "TrailingSL", ParamColor( "Color", colorCycle ));
//Author: Praveen.
//xxxxxxxxxxxxxxxxxxxxxxxxxxxxxxxxxxxxxxxxxxxxxxxxxxxxxxxxxxxxxxxxxxxxxxxxxxxxxxxxxxxxxxxxxxxxxxxxxxxxxxxxxxxxxxxxxxxxxxxxxxxxxxxxxx

//FORMULE
stochup= StochK()>StochD() ;
stoch50= StochK()<50 ;
MACDup= MACD()>Signal() ;
Hist= MACD()-Signal() ;
Histup= Hist>Ref(Hist,-1) ;
MFIupema5= MFI()>EMA(MFI(),5) ;
MFI30= MFI()>30 ;
Cupo= C>O ;
MA10up= MA(C,10)>Ref(MA(C,10),-1) ;
MA20up= MA(C,20)>Ref(MA(C,20),-1) ;
EMA50up= EMA(C,50)>Ref(EMA(C,50),-1) ;
Cupma20= C>MA(C,20) ;
PDIupmdi= PDI()>MDI() ;
Cond= pointer<4 ;
haup= HaClose>=HaOpen ;
HaCloseuptop1= HaClose>BBandTop( C, 20,1 ) ;
top2up= BBandTop(C,20,2)>Ref(BBandTop(C,20,2),-1) ;
Cuptop1= C>BBandTop(C,20,1) ;
nogap= O<=Ref(H,-1) ;
Cupma10= C>MA(C,10) ;
Vdrule= Ref(L,-2)>C AND Ref(L,-1)>C ;
CupTrailingSL= C>TrailingSL ;
//xxxxxxxxxxxxxxxxxxxxxxxxxxxxxxxxxxxxxxxxxxxxxxxxxxxxxxxxxxxxxxxxxxxxxxxxxxxxxxxxxxxxxxxxxxxxxxxxxxxxxxxxxxxxxxxxx

//PARAMTOGGLE
// This combines indicators into one timing Signal
//function ParamOptimize( description, default, minv, maxv, step )
//    { return Optimize(description, Param(description,default, minv, maxv, step ), minv, maxv, step ); }
tgl = ParamToggle("Result", "AND logic|Compare");
// switch test calculation and compare the results
if(tgl)
{
myBuy = CupTrailingSL AND macdup AND histup AND cond AND cupo AND ema50up AND ma20up ;
myShort = !CupTrailingSL AND !stochup AND Vdhadelta AND !Cupo ;
}
else
{
myBuy   = IIf( C>TrailingSL AND MACD()>Signal() AND Hist>Ref(Hist,-1) AND pointer<4 AND C>O AND
          EMA(C,50)>Ref(EMA(C,50),-1) AND MA(C,20)>Ref(MA(C,20),-1)    ,1,0);
myShort = IIf( C<TrailingSL AND StochK()<StochD() AND hadelta<MAhadelta AND C<O      ,1,0);
}

Buy = ExRem(myBuy, myShort);
Sell = ExRem(myShort, myBuy);

PlotShapes(IIf(Buy,shapeUpArrow,shapeNone),colorBlue,0,haLow,Offset=-10);
PlotShapes(IIf(Sell,shapeDownArrow,shapeNone),colorRed,0,Hahigh,Offset=-10);
2 comments
Leave Comment
Please login here to leave a comment.
BAD … USELESS INDICATOR
If someone interested in Trend Following… go for TREND QUALITY INDICATOR — http://wisestocktrader.com/indicators/742-trend-quality-indicator – Its good one