Nirvana Modified for Amibroker (AFL)
dkeleher about 14 years ago Amibroker (AFL)
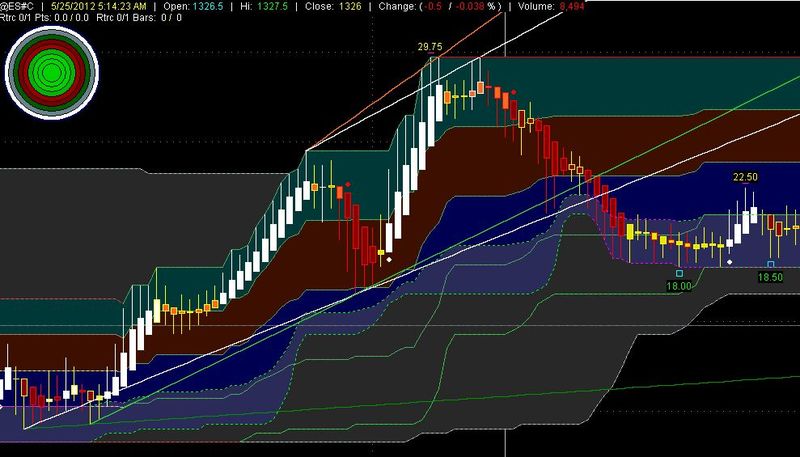
The original Nirvana code was created by MRTQ13 and uploaded by Agoon. In addition to cleaning up the original code for performance some features have been added. Trend Lines that extend beyond the final price bar have been added, user can select whether to use Zig % or Fractals for pivot recognition. Trend Lines exist for 1st, 2nd & 3rd Hi & Lo pivots. Use trend line from 2nd to 3rd pivot to avoid looking into future. Price labels have been added for the pivots including last highest and lowest prices since most recent pivots. Colors have been added to the short band lines for easy visual trend identification. An Optional setting has been added for overlaying standard price bars on Heiken-Ashi Candles. The Fib setup in the Gordon Rose version pivots has been modified and works well for intraday trading. I am a discretionary trader and avoid bloated code so I have not created exploration or Buy Sell filters for the setup. The fibs only appear when the proper symmetry exists – the conditions are noted in the code – they work well.
Kudos to MRTQ13 for some nice work on the original code – my thanks to Agoon for posting it. Just a note to all – when using code that was originated by someone else – DON"T PLAGIARIZE – provide the name of the original author of the work!!
Thanks
Screenshots
Indicator / Formula
//=============================
_SECTION_BEGIN("Chart Settings");
//=============================
   Version(5.40);
   //Original code created by MRTQ13 May,2012
   //Modified by D. Keleher May 2012 with following:
   //1.  Clean version of Gordon Rose pivots with modified Fib Retraces
   //2.  Added Loop Price Labels and Lowest / Highest price since last pivots
   //3.  Added TrendLines with selectable Fractal or Zig % settings
   //4.  Provide functionality for extending trendlines beyond last bar
   //5.  Added "Bar Overlay" option for Price plotting
   //6.  Provided Line Colors for Short Bands indicating trend direction
   //7.  Cleaned up code for minor performance improvement
   // To do list includes explorations and scans for price patterns
   // and indicator signals
   SetChartOptions(0,chartShowArrows|chartShowDates);
   GraphXSpace=Param("GraphXSpace",10,0,300,1);
   SetChartBkColor(ParamColor("Outer Panel",53));
   SetChartBkGradientFill(ParamColor("Upper Chart",16),ParamColor("Lower Chart",16));
//==========================
_SECTION_BEGIN("Forex Main");
//==========================
   global hO,hH,hL,hC,fO,fH,fL,fC,bc,Lx,x;
   x=BarIndex();  bc=BarCount;  Lx=LastValue(x);
   //Flower OHLC
   fC=EMA((O+H+L+C)/4,3);         fO=EMA((Ref(O,-1)+Ref(fC,-1))/2,3);
   fH=EMA(Max(Max(H,fO),fC),3);   fL=EMA(Min(Min(L,fO),fC),3);
   //Heiken Ashi OHLC
   hC=EMA((O+H+L+C)/4,3);         hO=AMA(Ref(hC,-1),0.5);
   hH=Max(H,Max(hC,hO));          hL=Min(L,Min(hC,hO));
   function ti3(y,t)  {
    s=0.84;
    e1=EMA(y,t);  e2=EMA(e1,t);  e3=EMA(e2,t);
    e4=EMA(e3,t); e5=EMA(e4,t);  e6=EMA(e5,t);
    c1=-s*s*s;    c2=3*s*s+3*s*s*s;
    c3=-6*s*s-3*s-3*s*s*s;
    c4=1+3*s+s*s*s+3*s*s;
   return T3=c1*e6+c2*e5+c3*e4+c4*e3; }
_SECTION_END();
//===========================
_SECTION_BEGIN("HEIKIN-ASHI");
//===========================
   //by Dan Valcu S&C Traders Tips Feb, 2004
   bsl=ParamToggle("Candle Type","HA,Std",0);
   olb=ParamToggle("Overlay Bars","Off|On",0);
   sco= ParamToggle("CandleFill Color","Std|Macd",1);
   r1=5;   r2=10;   r3=5;//MACD Fast,Slow & Signal Periods
   ap=4;//ATR & Hi Lo Periods
   pd=7;//HHV LLV Lookback
   atv=ATR(ap);  sup=HHV(LLV(L,ap)+atv,pd);  res=LLV(HHV(H,ap)-atv,pd);
   fC=EMA((O+H+L+C)/4,3);//Flower Close
   hC=(O+H+L+C)/4;        hO=AMA(Ref(fC,-1),0.5);
   hH=Max(H,Max(fC,hO));  hL=Min(L,Min(fC,hO));
   m1=MACD(r1,r2);   s1=Signal(r1,r2,r3);  uc=ColorRGB(230,230,0);
   mco=IIf(m1<0 AND m1>s1,uc,IIf(m1>0 AND m1>s1,55,IIf(m1>0 AND m1<s1,25,24)));
   if(sco)SetBarFillColor(mco);
   if(bsl==1)PlotOHLC(O,H,L,C,"",IIf(C>O,55,32),64);
   if(bsl==0)PlotOHLC(hO,hH,hL,fC,"",IIf(C>sup,55,IIf(C<res,32,42)),64);
   bco=IIf(m1<0 AND m1>s1,uc,IIf(m1>0 AND m1>s1,43,IIf(m1>0 AND m1<s1,32,42)));
   if(bsl==0 AND olb)Plot(C,"",bco,128|4096,0,0,0,1);
_SECTION_END();
//===========================
_SECTION_BEGIN("Line Style's");
//===========================
   nr= ParamToggle("No Rescale","Off|On",1)*2048;
   al= ParamToggle("Axis Labels","On|Off",1)*4096;
   s01=1|al|nr;    s04=4|al|nr;     s08=8|al|nr;
   s32=32|al|nr;   s36=36|al|nr;    s41=41|al|nr;
   s51=512|al|nr;  s52=512|4|al|nr;
   xp=BarCount+2;
//================================
_SECTION_BEGIN("Breakout Setting");
//================================
   bpd=Param("Breakout periods best is usually 18",5,1,100,1,1);
   spd=Param("Exit Breakout",5,1,100,1,1);
   Buy=C>Ref(HHV(H,bpd),-1);   Sell=C<Ref(LLV(L,spd),-1);
   Buy=ExRem(Buy,Sell);        Sell=ExRem(Sell,Buy);
   PlotShapes(Buy*shapeSmallCircle,55,0,hL,-10);
   PlotShapes(Sell*shapeSmallCircle,32,0,hH,10);
_SECTION_END();
//===========================
_SECTION_BEGIN("Pivot Box");
//===========================
   Hi=Param("Hi Periods",7,1,50,1);
   Lo=Param("Lo Periods",7,1,50,1);
   A1=ExRemSpan(Ref(H,-2)==HHV(H,Hi),3);
   A2=ExRemSpan(Ref(L,-2)==LLV(L,Lo),3);
   A3=Cross(A1,0.9);   A4=Cross(A2,0.9);
   Top=Ref(hH,-BarsSince(A3));
   tbk=Param("Hi Breakout Periods",10,2,30,0.1);
   yr=IIf(x>=bc-tbk,EndValue(Top),Null);
   Plot(yr,"",ParamColor("Line Color",25),s52);
   //Plot(top,"",11,styleDots+styleLine+styleThick);
   bot=Ref(hL,-BarsSince(A4));
   bbk=Param("Lo Breakout Periods",10,2,30,0.1);
   ys=IIf(x>=bc-bbk,EndValue(bot),Null);
   Plot(ys,"",ParamColor("Support Color",43) ,s52);
   //Plot(bot,"",6,styleDots+styleLine);
_SECTION_END();
//============================
_SECTION_BEGIN("Price Line");
//============================
   p= ParamField("Price Field",3);
   bk= Param("Bars Back",500,10,900,1);
   yy=IIf(x>=bc-bk,EndValue(p),Null);
   Plot(yy,"Price",colorGrey40,s36);
_SECTION_END();
//===========================
_SECTION_BEGIN("MA Averages");
//===========================
   if(ParamToggle("Plot MA-21","Off|On",0))Plot(MA(C,21),"",27,s01);
   if(ParamToggle("Plot MA-55","Off|On",0))Plot(MA(H,55),"",55,s01);
   if(ParamToggle("Plot MA-233","Off|On",0))Plot(MA(H,233),"",52,s01);
_SECTION_END();
//===========================
_SECTION_BEGIN("WMA Averages");
//===========================
   if(ParamToggle("Plot WMA-20","Off|On",0))Plot(WMA(C,20),"",26,s08,0,0,1);
   if(ParamToggle("Plot WMA-60","Off|On",0))Plot(WMA(C,60),"",19,s08,0,0,1);
   if(ParamToggle("Plot WMA-100","Off|On",0))Plot(WMA(C,100),"",30,s08,0,0,1);
   if(ParamToggle("Plot WMA-120","Off|On",0))Plot(WMA(C,120),"",12,s08,0,0,1);
   if(ParamToggle("Plot WMA-180","Off|On",0))Plot(WMA(C,180),"",31,s08,0,0,1);
   if(ParamToggle("Plot WMA-500","Off|On",0))Plot(WMA(C,500),"",47,s08,0,0,1);
//===========================
_SECTION_BEGIN("Avg I Select");
//===========================
   s=ParamList("AverageType","Off|DEMA|EMA|HMA|Lagless|LinReg|MA|TEMA|Weighted|Wilders",0);
   t=Param("Periods",20,2,200);
   d=Param("Displacement",1,0,50,1);
   p=hC;     m=Null;
   if(s=="DEMA")m=DEMA(p,t);   if(s=="EMA")m=EMA(p,t);  if(s=="HMA")m=WMA(2*(WMA(P,t/2))-WMA(p,t),4);
   if(s=="Lagless")m=2*EMA(p,t)-EMA(EMA(p,t),t);        if(s=="LinReg")m=LinearReg(p,t);
   if(s=="MA")m=MA(p,t);                                if(s=="TEMA")m=TEMA(P,t);
   if(s=="Weighted")m=WMA(p,t);                         if(s=="Wilders")m=Wilders(p,t);
   Plot(m,"",ParamColor("Color",26),s01,d);
_SECTION_END();
//===========================
_SECTION_BEGIN("Avg II Select");
//===========================
   s=ParamList("AverageType","Off|DEMA|EMA|HMA|Lagless|LinReg|MA|TEMA|Weighted|Wilders",0);
   t=Param("Periods",60,2,200);
   d=Param("Displacement",1,0,50,1);
   p=hC;     m=Null;
   if(s=="DEMA")m=DEMA(p,t);   if(s=="EMA")m=EMA(p,t);  if(s=="HMA")m=WMA(2*(WMA(P,t/2))-WMA(p,t),4);
   if(s=="Lagless")m=2*EMA(p,t)-EMA(EMA(p,t),t);        if(s=="LinReg")m=LinearReg(p,t);
   if(s=="MA")m=MA(p,t);                                if(s=="TEMA")m=TEMA(P,t);
   if(s=="Weighted")m=WMA(p,t);                         if(s=="Wilders")m=Wilders(p,t);
   Plot(m,"",ParamColor("Color",27),s01,d);
_SECTION_END();
//===========================
_SECTION_BEGIN("Bands Short");
//===========================
   sb= ParamToggle("Short Bands Cloud","Off|On",1);
   bl= ParamToggle("Short Bands Lines","Off|On",1);
   bk= Param("Periods",40,10,900,1);
   if(sb OR bl) {  st=32|512|2048|4096;
    Hi=HHV(H,bk);  Lo=LLV(L,bk);  kM=(Hi+Lo)/2;  kH=(kM+Hi)/2;  kL=(kM+Lo)/2;
   if(bl) {
    nhi= IIf(Hi>Ref(Hi,-1),1,IIf(Hi<Ref(Hi,-1),-1,0));  hco=IIf(ValueWhen(nhi!=0,nhi)==-1,32,34);
    nlo= IIf(Lo>Ref(Lo,-1),1,IIf(Lo<Ref(Lo,-1),-1,0));  lco=IIf(ValueWhen(nlo!=0,nlo)==-1,32,43);
    nkh= IIf(kH>Ref(kH,-1),1,IIf(kH<Ref(kH,-1),-1,0));  khc=IIf(ValueWhen(nkh!=0,nkh)==-1,25,34);
    nkm= IIf(kM>Ref(kM,-1),1,IIf(kM<Ref(kM,-1),-1,0));  kmc=IIf(ValueWhen(nkm!=0,nkm)==-1,42,34);
    nkl= IIf(kL>Ref(kL,-1),1,IIf(kL<Ref(kL,-1),-1,0));  klc=IIf(ValueWhen(nkl!=0,nkl)==-1,40,34);
    Plot(Hi,"",hco,s32);  Plot(Lo,"",lco,s32);  Plot(kM,"",kmc,s32);
    Plot(kH,"",khc,s32);  Plot(kL,"",klc,s32);  }
    uc1=ParamColor("Up Cloud Color 1",ColorRGB(0,55,55));
    uc2=ParamColor("Up Cloud Color 2",ColorRGB(60,15,0));
    dc1=ParamColor("Dn Cloud Color 1",ColorRGB(0,0,83));
    dc2=ParamColor("Dn Cloud Color 2",ColorRGB(43,43,89));
   if(sb) {
    Lo=LLV(L,22);   kL=(kM+Lo)/2;
    if(bl) {
     nkl= IIf(kL>Ref(kL,-1),1,IIf(kL<Ref(kL,-1),-1,0));  klc=IIf(ValueWhen(nkl!=0,nkl)==-1,11,43);
     nlo= IIf(Lo>Ref(Lo,-1),1,IIf(Lo<Ref(Lo,-1),-1,0));  lco=IIf(ValueWhen(nlo!=0,nlo)==-1,11,43);
     Plot(Lo,"",lco,s32,0,0,0,1);   Plot(kL,"",klc,s32,0,0,0,1);  }
    st= styleCloud||512|2048|4096|styleNoTitle;
    PlotOHLC(Hi,Hi,kH,kH,"",uc1,st);   PlotOHLC(kH,kH,kM,kM,"",uc2,st);
    PlotOHLC(kM,kM,kL,kL,"",dc1,st);   PlotOHLC(kL,kL,Lo,Lo,"",dc2,st);  }
   }
_SECTION_END();
//===========================
_SECTION_BEGIN("Bands Long");
//===========================
   pl= ParamToggle("Long Bands Cloud","Off|On",1);
   bl= ParamToggle("Long Bands Lines","Off|On",1);
   srf=Param("Sup-Res Short",30,0,100,1);
   ret=Param("Res Long",160,0,350,1);
   sut=Param("SupLong",60,0,350,1);
   x0=Param("Cloud Bar Length",300,1,500,1);
   co=ParamColor("Cloud Color",23);
   st=512|2048|4096;
   Hf=HHV(hH,srf);   Lf=LLV(hL,srf);    Hr=HHV(hH,ret);  Ls=LLV(hL,sut);
   if(bl) { Plot(Hr,"",47,s32); Plot(Ls,"",47,32); }
   if(pl) {
    for(i=0;i<BarCount-x0;i++) { co[i] = colorBlack; }//hide the line except most recent 10 bars
     PlotOHLC(Ls,Ls,Hr,Hr,"",co,styleCloud|st); }
_SECTION_END();
//=============================
_SECTION_BEGIN("Rose Pivots");
//=============================
  //Original Code by Gordon Rose
  //Modified by D. Keleher 2008
   plb= ParamToggle("Pivot Price Text","Off|On",1);
   txl= ParamToggle("Last Price Text","Off|On",1);
   plf= ParamToggle("Fib Retracements","Off|On",1);
   nbz= Param("Swing Bar Min",12,5,40);
   stn= Param("Digit Length",5,1,10,1);
   xMn= Param("Minimum Pivot Bars",1,1,10,1);
   th= Param("Adjust Hi Label",1.4,0,10,0.1)*TickSize;
   td=1.2;//String Decimals
   tol= 0.01;//Price Tolerance
   tpr= 0.005;//Retrace % Adjust Tolerance
   lbk= 120;
   expX= 0;  expD= 0;//Explore Bar Index and Explore Date
   dnc= 0;   dn= DateNum();  ulv=1; //Use Last Visible Bar
   Long=False;  Shrt=False;  rTitle="";
   if(plf OR txl OR plf) {
    // 1= Indicator  2= Commentary  3= Scan 4= Explore  5= Backtest / Optimize
    if(Status("action")==1) {plf=True; } else { plf=False; ulv= False; trc= False;
	 expD= Status("RangeToDate");
	 for(i=LastValue(BarIndex());i>=0;i--) { dnc=dn[i];
     if(dnc==expD) { expX=i;} }
    }
    //======== Initialize Arrays ========
    xp= 0;     xhp= 0;   xlp=0;  yr0=0;
    xr0= 0;    ys0= 0;   xs0=0;
    yR=H-H;    xR=H-H;   yS=L-L;   xS=L-L;
    pk= H-H;  xr1=H-H;  tr=L-L;  xs1=L-L;
    //======================
    HHx= HHVBars(H,nbz);   LLx= LLVBars(L,nbz);
    lvb= LastValue(Highest(IIf(Status("BarVisible"),x,0)));
    xx= IIf(lvb>0 AND ulv,lvb,IIf(Status("action")==4 AND expX>0,expX,LastValue(x)));
    dir= "";
    if(LLx[xx]<HHx[xx])dir="D"; else dir="U";
    //======== Find Main Pivots ========
    if(xx>=lbk) { for(i=0; i<lbk; i++) { // xx>=lbk insures enough bars exist
     xx= IIf(lvb>0 AND ulv,lvb-i,IIf(Status("action")==4 AND expX>0,expX-i,LastValue(x)-i));
     if(LLx[xx]<HHx[xx]) { //LLV bars < HHV Bars == Down
      if(dir=="U") { dir= "D";//If direction was up change it to down
       xp= xx-LLx[xx]; tr[xp]=1; yS[xlp]=L[xp]; xS[xlp]=xp; xlp++; }  } //Capture pivot information
      else { if(dir=="D") { dir= "U";// or if Dir was Down change it to up
				xp=xx-HHx[xx]; pk[xp]=1;  yR[xhp]=H[xp]; xR[xhp]=xp; xhp++; } } }  }//== Found Main Pivots
    //======= Find Missed Pivot(s) ======
   //Start at last bar. Reestablish xx
    xx= IIf(lvb>0 AND ulv,lvb,IIf(Status("action")==4 AND expX>0,expX,LastValue(x)));
    if(xhp>= 2 AND xlp>= 2) { //at least two of each must exist.
     xs0= xS[0];      ys0=yS[0];           xr0=xR[0];    yr0=yR[0];    xmx=Max(xs0,xr0);  cbz=xx-xmx;
     LLy=LLV(L,cbz);  LLb=LLVBars(L,cbz);  yLo=LLy[xx];  xLo=xx-LLb[xx];
     HHy=HHV(H,cbz);  HHb=HHVBars(H,cbz);  yHi=HHy[xx];  xHi=xx-HHb[xx];
     if(xr0>xs0) {
     if (yR[0]<yR[1]) { //Current Hi < Previous Hi
      if(yLo<yS[0] AND (xLo-xr0-1)>=xMn AND xLo!=xx) { tr[xLo]=1; xs1[xLo]=1;
       for(j=0; j<xlp; j++) { yS[xlp-j]=yS[xlp-(j+1)]; xS[xlp-j] = xS[xlp-(j+1)]; }
         yS[0]= yLo; xS[0]= xLo; xlp++; }  }
        else { if(yLo>yS[0] AND (xLo-xr0-1)>=xMn AND xLo!= xx) { tr[xLo]=1;  xs1[xLo]=1;
         for(j=0; j<xlp; j++) {yS[xlp-j]=yS[xlp-(j+1)];  xS[xlp-j]= xS[xlp-(j+1)]; }
          yS[0]= yLo;  xS[0]=xLo;  xlp++;  }  }  }
        else { if(yR[0]<yR[1]) { if(yHi<yR[0] AND (xHi-xs0-1)>=xMn AND xHi!= xx) { pk[xHi]=1; xr1[xHi]=1;
         for(j=0;j<xhp; j++) { yR[xhp-j]= yR[xhp-(j+1)];  xR[xhp-j]= xR[xhp-(j+1)]; }
          yR[0]=yHi;  xR[0]=xHi;  xhp++;  }  }
        else {  if(yHi>yR[0] AND (xHi-xs0-1)>=xMn AND xHi!=xx) {  pk[xHi]=1;  xr1[xHi]=1;
         for(j=0; j<xhp; j++) {  yR[xhp-j]= yR[xhp-(j+1)];xR[xhp-j]= xR[xhp-(j+1)];	}
          yR[0]=yHi;  xR[0]=xHi;xhp++;  }  }  }
    }

     //Retracements
    bars=0;     prcR= H-H;  retP=0;   retB= H-H;
    retX=0;     retC=0;     retY=C;
    rt0Pts=0;   rt0brz=0;   rt1Pts=0;  rt1brz=0;
    i50=Null;   i62=Null;   i78=Null;
    //Retracement calcs. Arrangement of pivs very specific for this setup.
    if(xhp>=2 AND xlp>=2 AND yR[0]>yR[1] AND yS[0]>yS[1]) {
     i50=(yR[0]-(0.50*(yR[0]-yS[1])));
     i62=(yR[0]-(0.62*(yR[0]-yS[1])));
     i78=(yR[0]-(0.79*(yR[0]-yS[0])));
     bars=xx-xR[0];   prcR=LLV(L,bars);   retB=LLVBars(L,bars);
     retP=prcR[xx];   retX=xx-retB[xx];   retC=retY[retX];
     Long=(i50>=(i78*(1-tpr))AND i62<=(i78*(1+tpr))AND retC >=((1-tol)*i62)AND retP<=((1+tol)*i50));  }
     //Lower Highs and Lower Lows
     else if(xhp>=2 AND xlp>=2 AND yR[0]<yR[1] AND yS[0]<yS[1]) {
      i50= (yR[1]-(0.500*(yR[1]-yS[0])));
      i62= (yR[0]-(0.618*(yR[1]-yS[0])));
      i78= (yR[0]-(0.786*(yR[0]-yS[0])));
      bars= xx-xS[0];   prcR= HHV(H,bars);   retB= HHVBars(H,bars);
      retP= prcR[xx];   retX= xx-retB[xx];   retC= retY[retX];
      //For Short Setups .500 is below .786 & .618 is above .786, Close is <= High & High >= Low of Ret range
      //Risk is top of zone - low of signal bar
      Shrt=( i50<=(i78*(1+tpr))AND i62>=(i78*(1-tpr))AND retC<=((1+tol)*i62)AND retP>=((1-tol)*i50)); }
    if(Shrt OR Long)  { // Show zone if present
     if(Shrt) { // Check Symmetry
      if(xS[0]>xR[0]) { rt0Pts=yR[0]-yS[1];  rt0brz=xR[0]-xS[1]+1;  rt1Pts=retP-yS[0];  rt1brz=retX-xS[0]+1; }
       else { rt0Pts=yR[1]-yS[1];  rt0brz=xR[1]-xS[1]+1;  rt1Pts=yR[0]-yS[0];  rt1brz=xR[0]-xS[0]+1; }  }
       else { // Long Setup
      if(xS[0]>xR[0]) {	rt0Pts=yR[0]-yS[1];  rt0brz=xR[0]-xS[1]+1;  rt1Pts=retP-yS[0];  rt1brz=retX-xS[0]+1; }
       else { rt0Pts=yR[1]-yS[0]; rt0brz=xS[0]-xR[1]+1;  rt1Pts=yR[0]-yS[0];  rt1brz=xS[0]-xR[0]+1; }  }
    }
    if(plf) {
      // .50 is above .786  & .62 is below .786 for long setups
      // .50 is below .786  & .62 is above .786 for short setups
     Plot(LineArray(IIf(Long,xR[0],xS[0]),i50,xx,i50,0),"i50",11,1|2048,0,0,0,1);
     Plot(LineArray(IIf(Long,xR[0],xS[0]),i62,xx,i62,0),"i62",43,1|2048,0,0,0,1);
     Plot(LineArray(IIf(Long,xR[0],xS[0]),i78,xx,i78,0),"i78",41,1|2048,0,0,0,1);
     PlotText(StrRight(NumToStr(i50,td),stn)+ " - 50%",xx+2,i50,11,1);
     PlotText(StrRight(NumToStr(i62,td),stn)+ " - 62%",xx+2,i62,43,1);
     PlotText(StrRight(NumToStr(i62,td),stn)+ " - 78%",xx+2,i78,41,1);  }
    if(plb) {
     for(i=LastValue(BarIndex()); i>=0;i--) {
      if(tr[i] )PlotText("\n\n"+ StrRight(NumToStr(L[i],td),5),i-1,L[i],43,1);
      if(pk[i])PlotText(StrRight(NumToStr(H[i],td),5),i-1,H[i]+th,42,1);  } }
    if(plf) {
     sq=shapeHollowSmallSquare; da=shapeDownArrow;  ua=shapeUpArrow;
     PlotShapes(pk*sq,11,0,H,8);  PlotShapes(xr1*sq,42,0,H,8);
     PlotShapes(tr*sq,10,0,L,-8);  PlotShapes(xs1*sq,43,0,L,-8);   }
    if(txl) {
     pb=LastValue(BarsSince(pk));       tb=LastValue(BarsSince(tr));
     fL=LastValue(LowestSince(pk,L));   xL=LastValue(ValueWhen(L==fL,x));
     fH=LastValue(HighestSince(tr,H));  xH=LastValue(ValueWhen(H==fH,x));
     Plot(LineArray(xL-3,fL,Lx,fL),"",43,36|4096|2048,0,0,2,1);
     Plot(LineArray(xH-3,fH,Lx,fH),"",40,36|4096|2048,0,0,2,1);
     PlotText(StrRight(NumToStr(fH,td),stn),Lx+2,fH,40,1);
     PlotText(StrRight(NumToStr(fL,td),stn),Lx+2,fL,43,1);  }

    Filter= (Shrt OR Long);
    AddColumn(C, "Close");
    AddColumn(IIf(Long,76,83),"L/S",formatChar);
   rTitle="\\c55\nRtrc 0/1 Pts: " + WriteVal(rt0Pts,2.1)  + "\\c42 / \\c55" + WriteVal(rt1Pts,2.1)+
          "   Rtrc 0/1 Bars: "    + WriteVal(rt0brz, 2.0) + " \\c42/ \\c55" + WriteVal(rt1brz,2.0);
  }
_SECTION_END();

//====================================
   //====== Fractal Peak Trough ======
   //Peak Trough Id By D. Keleher 2008
   x= BarIndex();
   function PkID(nn)	  {
    pk=H==HHV(H,2*nn) AND Ref(HHV(H,nn),nn)<H;
   return pk AND LastValue(x)-ValueWhen(pk,x)>nn;  }
   function TrID(nn)  {
    tr=L==LLV(L,2*nn) AND Ref(LLV(L,nn),nn)>L;
   return tr AND LastValue(x)-ValueWhen(tr,x)>nn;  }
   //====== Selected Value Function ======
   function svp(y,x,Lb){ return SelectedValue(ValueWhen(y,x,Lb));  }
   //====== Extended Line Function ======
   function exln(x1,y1,x0,y0,ex,co,st) {
    Plot(la=LineArray(x1-ex,y1,x0-ex,y0,1),"",co,st,0,0,ex,1);
   return la; }
//===========================
_SECTION_BEGIN("Fractal Wedge");
//===========================
   //original by Dimitris Tsokakis 2003
   //versions by D. Keleher 2004 - 2008
   pl= ParamToggle("Wedge Lines","Off|On",0);
   pvt=ParamToggle("Pivot Types","Fractal|Zig %",0);
   pct=Param("Percent",0.20,0.01,5,0.01);
   nb= Param("Fractal Bars",5,2, 200,1);
   ex= Param("Extend Right",1,0,50,1);
   rs= ParamToggle("No Rescale ","Off|On",1)*2048;
   st= ParamStyle("Style",4|4096)|rs;  s32=36|2048;
	if(pl)  {
     S=L;   R=H;
    if(pvt==0) { pS=TrID(nb);                pR=PkID(nb); }
    if(pvt==1) { pS=TroughBars(S,pct,1)==0;  pR=PeakBars(R,pct,1)==0; }
    xs1=svp(pS,x,1);   xs2=svp(pS,x,2);   xs3=svp(pS,x,3);
    xr1=svp(pR,x,1);   xr2=svp(pR,x,2);   xr3=svp(pR,x,3);
    ys1=svp(pS,L,1);   ys2=svp(pS,L,2);   ys3=svp(pS,L,3);
    yr1=svp(pR,H,1);   yr2=svp(pR,H,2);   yr3=svp(pR,H,3);
    exln(xs2,ys2,xs1,ys1,2,34,st);  exln(xr2,yr2,xr1,yr1,2,32,st);
    exln(xs3,ys3,xs1,ys1,2,55,st);  exln(xr3,yr3,xr1,yr1,2,55,st);
    exln(xs3,ys3,xs2,ys2,2,27,st);  exln(xr3,yr3,xr2,yr2,2,25,st);
   }
_SECTION_END();
//=============================
_SECTION_BEGIN("Daily Trend");
//=============================
   GfxSelectFont("Arial",10,100);   GfxSetBkMode(1);  GfxSetTextColor(42);
   tf=5;   ts=8;
   TimeFrameSet (inDaily);
   tf=ti3(C,tf);   ts=ti3(C,ts);
   TimeFrameRestore();
   Bear= WriteIf(C<tf AND C<ts,"Bear","");   revD= WriteIf(C<tf AND C>ts,"revD","");
   Bull= WriteIf(C>tf AND C>ts,"Bull","");   revU= WriteIf(C>tf AND C<ts,"revU","");
   if(revU=="revU") { GfxSelectSolidBrush(55); }
    else if(Bull=="Bull"){ GfxSelectSolidBrush(ColorRGB(113,255,113)); }
    else if(revD=="revD"){ GfxSelectSolidBrush(colorGrey40); }
    else if(Bear=="Bear"){ GfxSelectSolidBrush(ColorRGB(255,113,113));  OP="M"; }
   GfxSelectPen(42,1);     GfxCircle(70,90,6);
//GfxTextOut( OP ,92,235) ;
   RequestTimedRefresh(0);
_SECTION_END();
//=============================
_SECTION_BEGIN("Weekly Trend");
//=============================
   TimeFrameSet(inWeekly);
   fa=ti3(C,4);  sa=ti3(C,5);
   TimeFrameRestore();
   Bear= WriteIf(C<fa AND C<sa,"Bearish","");   revD= WriteIf(C<fa AND C>sa,"Reverse Dn","");
   Bull= WriteIf(C>fa AND C>sa,"Bullish","");   revU= WriteIf(C>fa AND C<sa,"Reverse Up","");
   if(revU=="Rev Up")      { GfxSelectSolidBrush(42);}
    else if(Bull=="Bull")  { GfxSelectSolidBrush(ColorRGB(0,50,0)); }
    else if(revD=="Rev Dn"){ GfxSelectSolidBrush(colorGrey40);  }
    else if(Bear=="Bear")  { GfxSelectSolidBrush(ColorRGB(50,0,0));  }
   GfxSelectPen(20,2);       GfxCircle(70,90,60);
   //GfxRoundRect(2,320,150,200,5,5);
   RequestTimedRefresh(0);
_SECTION_END();
//=============================
_SECTION_BEGIN("Trending Ribbon");
//=============================
   TimeFrameSet (inDaily);
   up=PDI()>MDI()AND Signal()<MACD();   dn=MDI()>PDI()AND Signal()>MACD();
   uw=WriteIf(Up,"Up","");              dw=WriteIf(Dn,"Dn","");
   if(uw=="Up")            { GfxSelectSolidBrush( ColorRGB(0,70,0));  }
    else if(dw=="Dn")      { GfxSelectSolidBrush( ColorRGB(70,0,0));  }
    else if(dw=="")        { GfxSelectSolidBrush(colorPaleBlue); }
   GfxSelectPen(16,0);       GfxCircle(70,90,54);
   TimeFrameRestore();
   //GfxRoundRect(15,305,135,215,5,5);
   RequestTimedRefresh(0);
_SECTION_END();
//==============================
_SECTION_BEGIN("ti3 Flower Trends");
//==============================
   ti5=ti3(fC,5);     ti7=ti3(fC,7);    ti9=ti3(fC,9);//Trend Averages
   upC5= WriteIf(fC>ti5,"upC5","");   dnC5= WriteIf(fC<ti5,"dnC5","");
   Up57= WriteIf(ti5>ti7,"Up57","");  Dn57= WriteIf(ti7>ti5,"Dn57","");
   Up79= WriteIf(ti7>ti9,"Up79","");  Dn79= WriteIf(ti9>ti7,"Dn79","");
   xxC5= WriteIf(Cross(fC,ti5),"xxC5","");
   xx75= WriteIf(Cross(ti7,ti5),"xx75","");
   //======== Slow Trend ========
   if(Up79=="Up79")        { GfxSelectSolidBrush(ColorRGB(0,90,0)); }
    else if(Dn79=="Dn79")  { GfxSelectSolidBrush(ColorRGB(90,0,0)); }
    else if(Dn79=="")      { GfxSelectSolidBrush(colorYellow);  }
   GfxSelectPen(16,1);       GfxCircle(70,90,48);
   //======== Mid Trend ========
   if(Up57=="Up57")        { GfxSelectSolidBrush(ColorRGB(0,120,0)); }
    else if(Dn57=="Dn57")  { GfxSelectSolidBrush(ColorRGB(120,0,0)); }
    else if(xx75=="xx75")  { GfxSelectSolidBrush(colorYellow); }
   GfxSelectPen(16,1);      GfxCircle(70,90,42);
   //======== Fast Trend ========
   if(upC5=="upC5")        { GfxSelectSolidBrush( ColorRGB(0,150,0));  }
    else if(dnC5=="dnC5")  { GfxSelectSolidBrush(ColorRGB(150,0,0));  }
    else if(xxC5=="xxC5")  { GfxSelectSolidBrush(colorYellow);  }
   GfxSelectPen(16,1);       GfxCircle(70,90,36);
_SECTION_END();
//=============================
_SECTION_BEGIN("Rays");
//=============================
   pd=3;   ap=2;   su=LLV(fH,pd);   av=ATR(ap);
   upATR= WriteIf(fC>HHV(su-av,4),"upATR","");
   dnATR= WriteIf(HHV(su-av,4)>fC,"dnATR","");
   if(upATR=="upATR")      { GfxSelectSolidBrush(ColorRGB(0,180,0));  }
    else if(dnATR=="dnATR"){ GfxSelectSolidBrush(ColorRGB(180,0,0));  }
    else if(upATR=="")     { GfxSelectSolidBrush(colorGrey40);  }
   GfxSelectPen(16,1);       GfxCircle(70,90,30);
_SECTION_END();
//=============================
_SECTION_BEGIN("Profit Taker");
//=============================
   pds=10;  atv=1.9*ATR(10);
   Ent= C>(LLV(fL,pds)+atv);     Xit= C<(HHV(fH,pds)-atv);
   EntU= WriteIf(Ent,"Ent","");  XitD= WriteIf(Xit,"Xit","");
   if(EntU=="Ent")         { GfxSelectSolidBrush(ColorRGB(0,210,0)); }
    else if(XitD=="Xit")   { GfxSelectSolidBrush(ColorRGB(210,0,0)); }
    else if(XitD=="")      { GfxSelectSolidBrush(colorGrey40); }
   GfxSelectPen(16,1);       GfxCircle(70,90,24);
   RequestTimedRefresh(0);
_SECTION_END();
//=============================
_SECTION_BEGIN("CCI 9-2 Trend");
//=============================
   up=WriteIf(CCI(9)>0,"upCCI","");   dn=WriteIf(CCI(8)<0,"dnCCI","");
   if(up=="upCCI")         { GfxSelectSolidBrush(ColorRGB(0,240,0)); }
    else if(dn=="dnCCi")   { GfxSelectSolidBrush(ColorRGB(240,0,0)); }
    else if(dn=="")        { GfxSelectSolidBrush(colorGrey40); }
   GfxSelectPen(16,1);       GfxCircle(70,90,18);
   RequestTimedRefresh(0);
_SECTION_END();
//=============================
_SECTION_BEGIN("% Bol Bands 7");
//=============================
   GfxSelectFont("Tahoma",12,100);  GfxSetBkMode(1);  GfxSetTextColor(55);
   GfxSelectFont("Arial",10,100);   GfxSetBkMode(1);  GfxSetTextColor(16);
   p=7;   dv=((C+2*StDev(C,p)-MA(C,p))/(4*StDev(C,p)))*100;
   upBB=WriteIf(dv>40,"upBB","");   dnBB=WriteIf(dv<40,"dnBB","");
   if(upBB=="upBB")        { GfxSelectSolidBrush(ColorRGB(62,255,62)); }
    else if(dnBB=="bd")    { GfxSelectSolidBrush(ColorRGB(255,62,62)); }
    else if(dnBB=="")      { GfxSelectSolidBrush(colorGrey40); }
   GfxSelectPen( 16,1);      GfxCircle(70,90,12);
   RequestTimedRefresh(0);
_SECTION_END();


   up=C> Ref(C, -1);  df=C-Ref(C,-1);
Title= "\\c55" + Name () + "   |   \\c42" + Date() + "\\c55   |   Open: \\c10" + O + "\\c55   |   Hi: \\c43 " + H +
       "\\c55   |   Close: \\c42 " + C + "\\c55   |   Change: ("+ WriteIf(up,"\\c43 ","\\c32 ") + df +
       "\\c55   /" + WriteIf(up,"\\c43","\\c32") + WriteVal(ROC(C,1)) + "\\c55 % )   |   Volume: " +
       WriteIf(V>Ref(V,-1),"\\c43 ","\\c32 ") + WriteVal(V,1) + rTitle;
25 comments
Leave Comment
Please login here to leave a comment.
Sir,
thank u for the modified AFL, am using ami 5.2, the AFL formula shwoing error, pls help me to use WITH AMI 5.2 ALSO.
thank u so much.
Thanks for the modified version of Nirvana.I am getting error 16. Please suggest , How to correct this error. I am using AB 5.10.
thank you for sharing.
ps. there is no low price in the chart title
For tigernifty and dineshpal – I believe you are receiving errors because the first line in the code sets the requirement for Amibroker to be version 5.40 or greater.
Remove the line and the code should work. If you run into additional errors after removing the Version(5.40) line then you will either have to upgrade your software or debug by eliminating code not supported in your older version of the software.
emososo – Thanks for the comment. I found a couple of things that needed some work so I will add the Low price to my list. I will upload the fix as a replacement for this code.
Gudwork sir…Nirvana is rocking…it vl b very helpful n reliable 4 trading…I think 1 vl look forward n make it an ultimate trading system…Thanx 4 posting!!
If someone can post it in a manner that works on Amibroker 5.1 it would be nice – original Nirvana works
Delete this line (Version(5.40);)it will work on Amibroker 5.1 also.
dkeleher,
My sincere regards for sharing the code.
Most of the basic funda is from southwind system.
But modification work is superb as chart looks very beautiful.
Please add also buy /sell arrowrs & exploration/scanning. People like me remember your help & conributions generations ahead.
Viswanath
dkeleher,
Can you please add pivot price text as full price.
Now it shows last 2 digits.
Is there any reason for keeping only 2 digits
Thanks
Viswanath
sir, am deleted the line VERSION 5.4, but problem not solved, again am facing error in line 175, 318 and 319..pls help me.. how to debug and solve this. am need ur help.. My cell: 9842406366. thx..
sir, good for the NIRVANA AFL, good work..thanks for submit the afl.. very use full…
the MODIFIED NIRVANA AFL ONLY (my version 5.2) am not getting chance for use..
am try to contact u for solving this, pls help me.. if possible give me ur cell number.. thanks once again…. my cell: 9842406366.
kv_maligi > “…add pivot price text as full price”
You should take the time to learn what each of the parameter settings do. “Digit Length” under Rose pivots permits the user to select the number of characters shown, Change it to whatever you desire.
Thanks dkeleher. God Bless you, Nirvana author & wisestocktrader.com
My rating 5m times
Viswanath
To all – I have found a couple of minor issues in the code that need attention – I will post and update for this code in the next couple of days – I am a discretionary trader and don’t need scans etc but I will include an exploration for patterns before uploading it again. Please post any suggestions you may have for consideration. Thanx
DK
tigernifty,
You haven’t given any kind of description regarding the errors you are having. The fact that some people have downloaded the code and are not experiencing errors means the problem is with your installation. I suggest you look to see if any line wrapping has occurred, if it has then fix it. If you can’t find the problem then start at the top of the code and use /* to disable parts of the code. Start at the top and work your way down through the code until you find the problem. Hope this helps.
DK
Dear DK sir, thanks for ur reply,
am facing the problem in line 175. col 31 (too many arguments)
line 175 col. 62 (too many arguments)
line 318, col. 61 (too many arguments)
line 319, col. 61 (too many arguments) this is the error message,.
am waiting for ur help. thx…
Cell: 9842406366
Shall be highly obliged if u cud pls include buy and sell prices in the modified afl for amateur traders to get a complete understanding of the system.
dkeleher,
Please add buy/sell arrows and exploration as per your expertise & post here nirvana
Thanks
dkeleher sir,
could u give the details how to use the nirvana system i.e.,
1. when buy and sell
2. timeframe for intraday
Thanks.
For details pls vist http://xtrator.wordpress.com/category/amibroker/afl-amibroker/
Thanks for MODIFIED to simple, it is very use full to enter and exit.
Hello,
Can this system be used for EOD trading on stocks? Or is it designed for intraday trading
thankyou..mark
Dear Contributor of this AFL and Admin,
As some of us are not having a great background, a small note on the usage of this AFL can immensely benefit us please. Greatly obliged if this request could be accommodated. Regards, Vishnu Vandana
Thanks for the modified version of Nirvana.