mk 3-80 Intraday for Nifty v1 for Amibroker (AFL)
mrkanitkar about 14 years ago Amibroker (AFL)
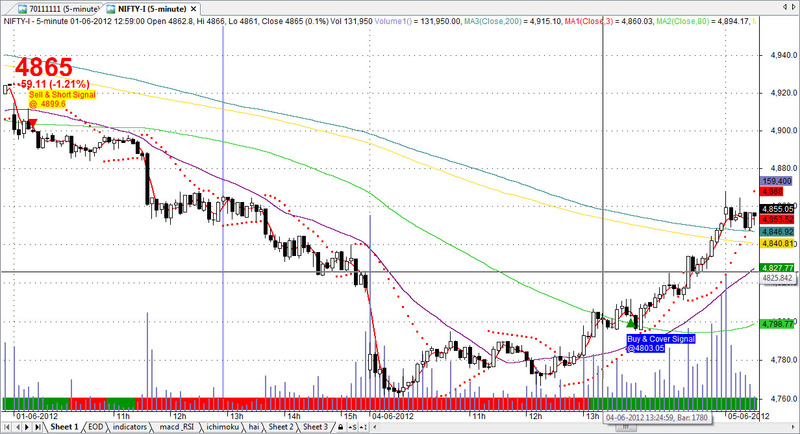
Here is updated one. I have added ribons as well.
Screenshots
Indicator / Formula
Copy & Paste Friendly
// Date 4 June 2012, Copyright: Maheshwar Kanitkar. mrkanitkar@gmail.com
// This is my new classic Moving crossover trading system with advance params.
// Setting slow and fast averages.
_SECTION_BEGIN("Price");
SetChartOptions(0,chartShowArrows|chartShowDates);
_N(Title = StrFormat("{{NAME}} - {{INTERVAL}} {{DATE}} Open %g, Hi %g, Lo %g, Close %g (%.1f%%) Vol " +WriteVal( V, 1.0 ) +" {{VALUES}}", O, H, L, C, SelectedValue( ROC( C, 1 )) ));
Plot( C, "Close", ParamColor("Color", colorBlack ), styleNoTitle | ParamStyle("Style") | GetPriceStyle() );
if( ParamToggle("Tooltip shows", "All Values|Only Prices" ) )
{
 ToolTip=StrFormat("Open: %g\nHigh:  %g\nLow:   %g\nClose:  %g (%.1f%%)\nVolume: "+NumToStr( V, 1 ), O, H, L, C, SelectedValue( ROC( C, 1 )));
}
_SECTION_END();

_SECTION_BEGIN("Price Interpretation");
movshort = ParamField("Short Time MA", 8 );
movmed = ParamField("Mid Time MA", 9 );
movlong = ParamField("Long Time MA", 10 );
btop = ParamField("BBTop", 11 );
bbot = ParamField("BBBottom", 12 );
if( Status("action") == actionCommentary )
{
width = btop - bbot;
lslop = LinRegSlope( C, 30 ) + 100;
lslo = LLV( lslop, 90 );
lshi = HHV( lslop, 90 );
lswidth = lshi - lslo;
trend = 100*( lslop - lslo )/lswidth;

mawidth = MA( width, 100 );
relwidth = 100*(width - mawidth)/mawidth;

_N( tname = Name()+"("+FullName()+")" );

printf("Price and moving averages:\n");
printf( tname + " has closed " + WriteIf( C > movshort, "above" , "below" ) + " its Short time moving average. ");

printf("\nShort time moving average is currently " + WriteIf( movshort > movmed, "above", "below") + " mid-time, AND " + WriteIf( movshort > movlong, "above", "below" ) + " long time moving averages.");

printf("\nThe relationship between price and moving averages is: "+
WriteIf( C > movshort AND movshort > movmed, "bullish",
WriteIf( C < movshort AND movshort < movmed, "bearish", "neutral" ) ) + " in short-term, and "+
WriteIf( movshort > movmed AND movmed > movlong , "bullish",
WriteIf( movshort < movmed AND movmed < movlong, "bearish", "neutral" ) ) + " in mid-long term. ");

printf("\n\nBollinger Bands:\n");
printf(tname+ " has closed " +
WriteIf( C < bbot, "below the lower band by " +
WriteVal( 100 *( bbot-C )/ width, 1.1 ) + "%%. " +
WriteIf( trend < 30, " This combined with the steep downtrend can suggest that the downward trend in prices has a good chance of continuing.  However, a short-term pull-back inside the bands is likely.",
WriteIf( trend > 30 AND trend < 70, "Although prices have broken the lower band and a downside breakout is possible, the most likely scenario for "+tname+" is to continue within current trading range.", "" ) ), "" ) +

WriteIf( C > btop, "above the upper band by " +
WriteVal( 100 *( C- btop )/ width, 1.1 ) + "%%. " +
WriteIf( trend > 70, " This combined with the steep uptrend suggests that the upward trend in prices has a good chance of continuing.  However, a short-term pull-back inside the bands is likely.",
WriteIf( trend > 30 AND trend < 70, "Although prices have broken the upper band and a upside breakout is possible, the most likely scenario for "+tname+" is to continue within current trading range.", "" ) ), "" ) +

WriteIf( C < btop AND ( ( btop - C ) / width ) < 0.5,
"below upper band by " +
WriteVal( 100 *( btop - C )/ width, 1.1 ) + "%%. ",
WriteIf( C < btop AND C > bbot , "above bottom band by " +
WriteVal( 100 *( C - bbot )/ width, 1.1 ) + "%%. ", "" ) ));

printf("\n"+
WriteIf( ( trend > 30 AND trend < 70 AND ( C > btop OR C < bbot ) ) AND abs(relwidth) > 40,
		 "This picture becomes somewhat unclear due to the fact that Bollinger Bands are  currently",
		 "Bollinger Bands are " )+
WriteVal( abs( relwidth ), 1.1 ) + "%% " +
WriteIf( relwidth > 0, "wider" , "narrower" ) +
" than normal.");

printf("\n");

printf(
WriteIf( abs( relwidth ) < 40, "The current width of the bands (alone) does not suggest anything conclusive about the future volatility or movement of prices.","")+
WriteIf( relwidth < -40, "The narrow width of the bands suggests low volatility as compared to " + tname + "'s normal range.  Therefore, the probability of volatility increasing with a sharp price move has increased for the near-term. "+
"The bands have been in this narrow range for " + WriteVal(BarsSince(Cross(-40,relwidth)),1.0) + " bars. The probability of a significant price move increases the longer the bands remain in this narrow range." ,"")+
WriteIf( relwidth > 40, "The large width of the bands suggest high volatility as compared to " + tname + "'s normal range.  Therefore, the probability of volatility decreasing and prices entering (or remaining in) a trading range has increased for the near-term. "+
"The bands have been in this wide range for  " + WriteVal(BarsSince(Cross(relwidth,40)),1.0) + " bars.The probability of prices consolidating into a less volatile trading range increases the longer the bands remain in this wide range." ,""));

printf("\n\nThis commentary is not a recommendation to buy or sell. Use at your own risk.");
}
_SECTION_END();

_SECTION_BEGIN("Volume1");
Plot( Volume, _DEFAULT_NAME(), ParamColor("Color", colorBlueGrey ), ParamStyle( "Style", styleHistogram | styleOwnScale | styleThick, maskHistogram  ), 2 );
_SECTION_END();

_SECTION_BEGIN("MA3");
P = ParamField("Price field",-1);
Periods = Param("Periods", 15, 2, 300, 1, 10 );
Plot( MA( P, Periods ), _DEFAULT_NAME(), ParamColor( "Color", colorCycle ), ParamStyle("Style") );
_SECTION_END();

_SECTION_BEGIN("MA1");
P = ParamField("Price field",-1);
Periods = Param("Periods", 15, 2, 300, 1, 10 );
Plot( MA( P, Periods ), _DEFAULT_NAME(), ParamColor( "Color", colorCycle ), ParamStyle("Style") );
_SECTION_END();

_SECTION_BEGIN("MA2");
P = ParamField("Price field",-1);
Periods = Param("Periods", 15, 2, 300, 1, 10 );
Plot( MA( P, Periods ), _DEFAULT_NAME(), ParamColor( "Color", colorCycle ), ParamStyle("Style") );
_SECTION_END();

_SECTION_BEGIN("MA4");
P = ParamField("Price field",-1);
Periods = Param("Periods", 15, 2, 300, 1, 10 );
Plot( MA( P, Periods ), _DEFAULT_NAME(), ParamColor( "Color", colorCycle ), ParamStyle("Style") );
_SECTION_END();

_SECTION_BEGIN("MA5");
P = ParamField("Price field",-1);
Periods = Param("Periods", 15, 2, 300, 1, 10 );
Plot( MA( P, Periods ), _DEFAULT_NAME(), ParamColor( "Color", colorCycle ), ParamStyle("Style") );
_SECTION_END();

_SECTION_BEGIN("Magnified Market Price");

FS=Param("Font Size",30,30,100,1);
GfxSelectFont("Arial", FS, 900, italic = False, underline = False, True );
GfxSetBkMode( colorWhite );
GfxSetTextColor( ParamColor("Color",colorRed) );
//Hor=Param("Horizontal Position",800,800,800,800);

Hor=Param("Horizontal Position",20,20,500,20);


Ver=Param("Vertical Position",50,50,250,50);
GfxTextOut(""+C,Hor , Ver );
YC=TimeFrameGetPrice("C",inDaily,-1);
DD=Prec(C-YC,2);
xx=Prec((DD/YC)*100,2);
GfxSelectFont("Arial", 12, 700, italic = False, underline = False, True );
GfxSetBkMode( colorWhite );
GfxSetTextColor(ParamColor("Color",colorYellow) );
GfxTextOut(""+DD+" ("+xx+"%)", Hor+5, Ver+45 );
_SECTION_END();

_SECTION_BEGIN("SAR");
acc = Param("Acceleration", 0.02, 0, 1, 0.001 );
accm = Param("Max. acceleration", 0.2, 0, 1, 0.001 );
Plot( SAR( acc, accm ), _DEFAULT_NAME(), ParamColor( "Color", colorCycle ), ParamStyle("Style", styleDots | styleNoLine, maskDefault | styleDots | styleNoLine ) );
_SECTION_END();

_SECTION_BEGIN("mk classic crossover 1");
// Date 4 June 2012, Copyright: Maheshwar Kanitkar. mrkanitkar@gmail.com
// This is my new classic Moving crossover trading system with advance params.
// Setting slow and fast averages.
//PositionSize = MarginDeposit = 1;
//PositionSize = 32000
//NumContracts = 1;
//PositionSize = NumContracts * MarginDeposit;
buyfast  = MA	(C,Param ("buy fast avg", 3, 2, 15, 3));
buyslow  =	 MA	(C, Param ("buy slow avg", 80, 15, 200, 5));
sellfast = MA (C,Param ("sell fast avg", 3, 2, 15, 3));
sellslow = MA (C, Param ("sell slow avg", 80, 2, 200, 5));
shortfast = MA (C,Param ("short fast avg", 3, 2, 15, 3));
shortslow = MA (C, Param ("short slow avg", 80, 2, 200, 5));
coverfast = MA (C,Param ("cover fast avg", 3, 2, 15, 3));
coverslow = MA (C, Param ("cover slow avg", 80, 15, 200,5));
MA30 = MA (Close, 30);

Buy = buyfast > buyslow AND buyfast > MA30 AND Volume > Ref( Volume , -5 ) AND Close > SAR( 0.02, 0.2 )AND MACD () > Signal ()  AND RSI (14) < 80 AND (ADX (14) > 20) AND Close > Ref( Close , -5 ) ;
Sell = sellfast < sellslow AND shortfast < MA30 AND Volume > Ref( Volume , -5 )AND SAR( 0.02, 0.2 ) > Close ;
Short =  shortfast < shortslow AND shortfast < MA30 AND Volume > Ref( Volume , -5 )AND SAR( 0.02, 0.2 ) > Close ;
Cover = coverfast > coverslow AND Close > SAR( 0.02, 0.2 );
//Sell = Sellone OR TimeNum() > 152000;
//Cover = Coverone OR TimeNum() > 152000;
AlertIf( Buy, "SOUND c:\Windows\Media\chimes.wav", "Buy alert", 2 );
AlertIf( Sell, "SOUND c:\Windows\Media\chimes.wav", "Sell alert", 3 );


//	ExRem removes the extra signals that occur between
//	the buy that enters a position and the sell that exits it.
//	Comment out the ExRem to see the extra buy signals.
//	Since the system is already in a long position,
//	and the system is set by default to take only one position,
//	the extra buy signals do not do anything.
Buy = ExRem(Buy,Sell);
Sell = ExRem(Sell,Buy);
Short = ExRem(Short,Cover);
Cover = ExRem(Cover,Short);

// New code
dist = 1.5*ATR(10);
for( i = 0; i < BarCount; i++ )
{
if( Buy[i] ) PlotText( "Buy & Cover Signal\n@" + C[ i ], i, L[ i ]-dist[i],
colorWhite, colorBlue );

if( Sell[i] ) PlotText( "Sell & Short Signal\n@  " + C[ i ], i, H[ i ]+dist[i],
colorRed, colorYellow );
//if( Short[i] ) PlotText( "Short\n@" + C[ i ], i, H[ i ]+dist[i], colorRed, colorYellow );
//if( Cover[i] ) PlotText( "Cover\n@" + C[ i ], i, L[ i ]-dist[i],colorGreen );
}
PlotShapes( Buy * shapeUpTriangle + Sell * shapeDownTriangle, IIf( Buy,colorGreen, colorRed ) );
_SECTION_END();

_SECTION_BEGIN("mkribbons");
// Putting  ribbons
Len1 = Optimize("Len1", 2, 2, 11, 1);
Len2 = Optimize("Len2", 10, 2, 21, 1);
Len3 = Optimize("Len3", 30, 2, 50, 1);
Len4 = 81;

//Indicators
MAz = Cum(0); //I believe MAz = 0; would be same as well.
MAy = C;
for (i = 1; i <= Len2; i++)
{
MAy = MA(MAy, Len1);
MAz = MAz + MAy;
}

STzero = IIf(HHV(C, Len2) - LLV(C, Len2)==0 ,0.00001,HHV(C, Len2) - LLV(C, Len2)); //just to avoid dividing be zero


SwingTrd1 =100 * ((C - (MAz / Len2)) / STzero);
Bull_Trend=EMA(SwingTrd1,Len4)>0;
Bear_Trend=EMA(SwingTrd1,Len4)<0;
Ribbon_kol=IIf(Bull_Trend,colorGreen, IIf(Bear_Trend,colorRed, colorBlack));
Plot(3, "ribbon", Ribbon_kol, styleOwnScale|styleArea|styleNoLabel, -0.5,100);
_SECTION_END();

_SECTION_BEGIN("MA");
P = ParamField("Price field",-1);
Periods = Param("Periods", 30, 2, 300, 1 );
Plot( MA( P, Periods ), _DEFAULT_NAME(), ParamColor( "Color", colorCycle ),
ParamStyle("Style") );
_SECTION_END();


//Topping Bar
//Range = H - L ;
//TPB = Volume > MA(Volume,9) AND Close < Low + Range/2 AND Range <= ef(Range,-1);
//PlotShapes(shapeSmallCircle * TPB,colorYellow,0,H,20);
2 comments
Leave Comment
Please login here to leave a comment.
Dear Sir
Kindly mail classic moving average crossover Nifty trading AFL code. It is good for nifty trading and good work done by you.
Email: chandra.b@sobha.com
Thanks in advance
Regards
sir as i putted this afl in ami broker there is difference then showing screenshot there is showing approx 6 moving averages & differ then screen shot …+ also not getting buy sell arrow or signal sir can u mail me this main afl on my email id plz
maulik00777@gmail.com is my id
thanks for ur support