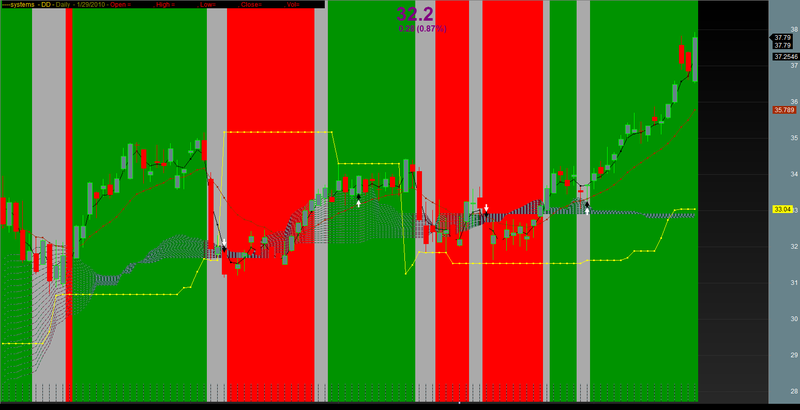
BUY-SELL RIBBON for Amibroker (AFL)
letsgrownow about 14 years ago Amibroker (AFL)
afl with BUY-SELL with trend ribbon area for easy decision for trading…
Screenshots
Indicator / Formula
Copy & Paste Friendly
_SECTION_BEGIN("Chart Settings");
	SetChartOptions(0,chartShowArrows|chartShowDates);
	SetChartBkColor(ParamColor("Outer Panel",colorPaleBlue));
	SetChartBkGradientFill(ParamColor("Upper Chart",1),ParamColor("Lower Chart",23));
	GraphXSpace=Param("GraphXSpace",10,0,100,1);
	dec = (Param("Decimals",2,0,7,1)/10)+1;
	bi = BarIndex();
	Lbi = LastValue(BarIndex());
	sbi = SelectedValue(bi);
	x1= BarCount-1;
Title = EncodeColor(55)+  Title = Name() + "     " + EncodeColor(32) + Date() +
"      " + EncodeColor(5) + "{{INTERVAL}}  " +
	EncodeColor(55)+ "     Open = "+ EncodeColor(52)+ WriteVal(O,dec) +
	EncodeColor(55)+ "     High = "+ EncodeColor(5) + WriteVal(H,dec) +
	EncodeColor(55)+ "      Low = "+ EncodeColor(32)+ WriteVal(L,dec) +
	EncodeColor(55)+ "    Close = "+ EncodeColor(52)+ WriteVal(C,dec)+
	EncodeColor(55)+ "    Volume = "+ EncodeColor(52)+ WriteVal(V,1);
_SECTION_END();


_SECTION_BEGIN("Price");
SetChartOptions(0,chartShowArrows|chartShowDates);
_N(Title = StrFormat("{{NAME}} - {{INTERVAL}} {{DATE}} Open %g, Hi %g, Lo %g, Close %g (%.1f%%) Vol " +WriteVal( V, 1.0 ) +" {{VALUES}}", O, H, L, C, SelectedValue( ROC( C, 1 )) ));
Plot( C, "Close", ParamColor("Color", colorBlack ), styleNoTitle | ParamStyle("Style") | GetPriceStyle() );
_SECTION_END();


_SECTION_BEGIN("a");
// 3 period EMA >>>>>>>>>>>>>>>>>>>>>>>>>>>>>>>>>>>>>>>>>>>>>>>>>>>>>>>>>>>>>>>>>>>>>>>>>>>>>>>>>>>>>>>>>>>>>
P3 = ParamField("Price field",-1);
Periods3 = Param("Periods3", 3 );
Plot( EMA( P3, Periods3 ), "3 EMA",ParamColor( "Color", colorBlack ),
ParamStyle("Style", styleDots) );

_SECTION_END();

_SECTION_BEGIN("b");
// 15 period EMA >>>>>>>>>>>>>>>>>>>>>>>>>>>>>>>>>>>>>>>>>>>>>>>>>>>>>>>>>>>>>>>>>>>>>>>>>>>>>>>>>>>>>>>>>>>

P15 = ParamField("Price field",-1);
Periods15 = Param("Periods15", 15);
Plot( EMA( P15, Periods15 ), "15 EMA",/*_DEFAULT_NAME(),*/ ParamColor( "Color", colorBrown ),
ParamStyle("Style", styleDots) );
_SECTION_END();

_SECTION_BEGIN("swing1");
no=20;
res=HHV(H,no);
sup=LLV(L,no);
avd=IIf(C>Ref(res,-1),1,IIf(C<Ref(sup,-1),-1,0));
avn=ValueWhen(avd!=0,avd,1);
supres=IIf(avn==1,sup,res);

a=Cross(C,supres);
b=Cross(supres,C);

//Plot(supres,"Swing",colorYellow,styleStaircase);
Plot(supres,"Swing",colorYellow,styleDots);

//SetChartBkGradientFill( ParamColor("BgTop", ColorRGB( 172,172,172 )),ParamColor("BgBottom", ColorRGB( 172,172,172 )),ParamColor("titleblock",ColorRGB( 172,172,172 )));


grid_day = IIf(Day()!=Ref(Day(),-1),1,0);
Plot(grid_day,"",colorDarkGrey,styleHistogram|styleDashed|styleNoLabel|styleOwnScale);


prev=AMA2(C,1,0);
d=IIf(C>( Ref(Max(Max(H,Ref(H,-20)),Max(Ref(H,-10),Ref(H,-15))),-1) ),Min(Min(L,Ref(L,-20)),Min(Ref(L,-10),Ref(L,-15))), IIf(C<Ref(Min(Min(L,Ref(L,-20)),Min(Ref(L,-10),Ref(L,-15))),-1),Max(Max(H,Ref(H,-20)),Max(Ref(H,-10),Ref(H,-15))),PREV));
a=Cross(Close,d);
b=Cross(d,Close);
state=IIf(BarsSince(a)<BarsSince(b),1,0);
s=state>Ref(state,-1);
ss=state<Ref(state,-1);
sss=state==Ref(state,-1);
col=IIf(state == 1 ,51,IIf(state ==0,4,1));

//Plot(C,"",Col,64);
PlotShapes( shapeUpArrow * s ,colorBlack,0,L, Offset=s);
PlotShapes( shapeUpArrow * s ,colorWhite,0,L, Offset=s-12);

PlotShapes( shapeDownArrow *ss ,colorBlack,0,H, Offset=s);
PlotShapes( shapeDownArrow *ss ,colorWhite,0,H, Offset=s-12);
_SECTION_END();


_SECTION_BEGIN("VWAP with SD band");

ND = Day() != Ref(Day(), -1);
_SECTION_BEGIN("LETSGROW");
SetChartOptions(0,chartShowArrows|chartShowDates);

_N(Title = StrFormat(" Open %g, Hi %g, Lo %g, Close %g (%.1f%%)", O, H, L, C, SelectedValue( ROC( C, 1 ) ) ));
 if( Status("action") == actionIndicator )
(
Title = EncodeColor(colorGold)+ "----systems " +  " - " +  Name() + " - " + EncodeColor(colorDarkYellow)+ Interval(2) + EncodeColor(colorDarkYellow) +
 "  - " + Date() +" - "+ EncodeColor(colorRed) + "Open = "+EncodeColor(colorBlack)+WriteVal(O,8.2) + EncodeColor(colorRed) + ", High = "+EncodeColor(colorBlack)+ WriteVal(H,8.2)+ EncodeColor(colorRed) + ", Low= "+EncodeColor(colorBlack)+ WriteVal(L,8.2)+ EncodeColor(colorRed ) + ", Close= "+EncodeColor(colorBlack)+ WriteVal(C,8.2)+ EncodeColor(colorRed) + ", Vol= "+EncodeColor(colorBlack)+ WriteVal(V,1)+("\n")
);

//Plot( C, "Close", ParamColor("Color", colorWhite ), styleNoTitle | ParamStyle("Style") | GetPriceStyle() );
 //Plot(C,"",colorRose, styleCandle );
Plot( C, "Close", ParamColor("Color", colorBlack ), ParamStyle("Style") | GetPriceStyle() );
Plot( O, "Open", ParamColor("Color", colorBlack ), styleNoDraw);
Plot( H, "High", ParamColor("Color", colorBlack ), styleNoDraw);
Plot( L, "Low", ParamColor("Color", colorBlack ),styleNoDraw);


 if( ParamToggle("Tooltip shows", "All Values|Only Prices" ) )
 {
 ToolTip=StrFormat("Open: %g\nHigh: %g\nLow: %g\nClose: %g (%.1f%%)\nVolume: "+NumToStr( V, 1 ), O, H, L, C, SelectedValue( ROC( C, 1 )));
 }


 SL = ( HHV( H, 26 ) + LLV( L, 26) )/2; // standard, base, or kijun-sen line
 TL = ( HHV( H, 9 ) + LLV( L, 9 ) )/2; // turning, conversion, or tenkan-sen line
 DL = Ref( C, 26 ); // delayed close price, or chikou span
 Span1 = Ref( ( SL + TL )/2, -25 ); //Span1 and Span2 define the clouds
 Span2 = Ref( (HHV( H, 52) + LLV(L, 52))/2, -25);

 hue = Param("Hue",140,0,255,1);
 sat = Param("Sat",100,0,255,1);
 bri = Param("bri",220,0,255,1);

Span1 = Ref( ( SL + TL )/2, -25 );		//Span1 and Span2 define the clouds
Span21 = Ref( (HHV( H, 52) + LLV(L, 52))/2, -25);

SR=Span1-Span21;
Span2=Span1-0.05*SR;
Span3=Span1-0.1*SR;
Span4=Span1-0.15*SR;
Span5=Span1-0.2*SR;
Span6=Span1-0.25*SR;
Span7=Span1-0.3*SR;
Span8=Span1-0.35*SR;
Span9=Span1-0.4*SR;
Span10=Span1-0.45*SR;
Span11=Span1-0.5*SR;
Span12=Span1-0.55*SR;
Span13=Span1-0.6*SR;
Span14=Span1-0.65*SR;
Span15=Span1-0.7*SR;
Span16=Span1-0.75*SR;
Span17=Span1-0.8*SR;
Span18=Span1-0.85*SR;
Span19=Span1-0.9*SR;
Span20=Span1-0.95*SR;

ColorKumo=IIf(C>Span1,ColorRGB(10,100,40),IIf(C<Span2,ColorRGB(100,10,40),colorGrey40));


Plot(Span1,"",ColorKumo,styleDashed|styleNoLabel);
Plot(Span2,"",ColorKumo,styleDashed |styleNoLabel);
Plot(Span3,"",ColorKumo,styleDashed|styleNoLabel);
Plot(Span4,"",ColorKumo,styleDashed|styleNoLabel);
Plot(Span5,"",ColorKumo,styleDashed|styleNoLabel);
Plot(Span6,"",ColorKumo,styleDashed|styleNoLabel);
Plot(Span7,"",ColorKumo,styleDashed|styleNoLabel);
Plot(Span8,"",ColorKumo,styleDashed|styleNoLabel);
Plot(Span9,"",ColorKumo,styleDashed|styleNoLabel);
Plot(Span10,"",ColorKumo,styleDashed|styleNoLabel);
Plot(Span11,"",ColorKumo,styleDashed|styleNoLabel);
Plot(Span12,"",ColorKumo,styleDashed|styleNoLabel);
Plot(Span13,"",ColorKumo,styleDashed|styleNoLabel);
Plot(Span14,"",ColorKumo,styleDashed|styleNoLabel);
Plot(Span15,"",ColorKumo,styleDashed|styleNoLabel);
Plot(Span16,"",ColorKumo,styleDashed|styleNoLabel);
Plot(Span17,"",ColorKumo,styleDashed|styleNoLabel);
Plot(Span18,"",ColorKumo,styleDashed|styleNoLabel);
Plot(Span19,"",ColorKumo,styleDashed|styleNoLabel);
Plot(Span20,"",ColorKumo,styleDashed|styleNoLabel);
Plot(Span21,"",ColorKumo,styleDashed|styleNoLabel);

 Buy = Cross(TL,SL);
 Sell = Cross(SL,TL);
 shape=Buy*shapeUpArrow + Sell*shapeDownArrow;
 //PlotShapes(shape,IIf(Buy,colorDarkGreen,colorRed), 0,IIf(Buy,Low,High));

 above = IIf(TL>Span1 AND TL>Span2,1,0);
 within = IIf(TL>Span1 AND TL<Span2,1,0);
 below = IIf(TL<Span1 AND TL<Span2,1,0);
 Buy = Cross(TL,SL) AND (DL>Close);
 Sell = Cross(SL,TL) AND (DL<SL);
 StrongBuy = Buy AND above;
 MediumBuy = Buy AND within;
 WeakBuy = Buy AND below;
 StrongSell = Sell AND below;
 MediumSell = Sell AND within;
 WeakSell = Sell AND above;
//////////////////////////////////////////////////code addition //////////////////////////////////////////////////////////////

GraphXSpace = 5;
dist = 4.5*ATR(10);


_SECTION_END();


_SECTION_BEGIN("trend");
uptrend=PDI(20)>MDI(10)AND Signal(29)<MACD(13);
downtrend=MDI(10)>PDI(20)AND Signal(29)>MACD(13);

Plot( 2, /* defines the height of the ribbon in percent of pane width */"ribbon",
IIf( uptrend, colorGreen, IIf( downtrend, colorRed, 0 )), /* choose color */
styleOwnScale|styleArea|styleNoLabel, 0, 1 );

_SECTION_END();


_SECTION_BEGIN("Magnified Market Price");

FS=Param("Font Size",28,11,100,1);
GfxSelectFont("Arial", FS, 700, italic = False, underline = False, True );
GfxSetBkMode( colorWhite );
GfxSetTextColor( ParamColor("Color",colorViolet) );

Hor=Param("Horizontal Position",766,1,1200,1);
Ver=Param("Vertical Position",1,1,1,1);
GfxTextOut(""+C,Hor , Ver );
GfxTextOut( Name(), Hor,Ver-50 );
YC=TimeFrameGetPrice("C",inDaily,-1);
DD=Prec(C-YC,2);
xx=Prec((DD/YC)*100,2);
GfxSelectFont("Arial", 12, 700, italic = False, underline = False, True );
GfxSetBkMode( colorWhite );
GfxSetTextColor(ParamColor("Color",colorViolet) );
GfxTextOut(""+DD+" ("+xx+"%)", Hor+5, Ver+45 );

_SECTION_END();
2 comments
Leave Comment
Please login here to leave a comment.
does this formula look into future?
???