MACD Waleedis for Amibroker (AFL)
waleedis about 14 years ago Amibroker (AFL)
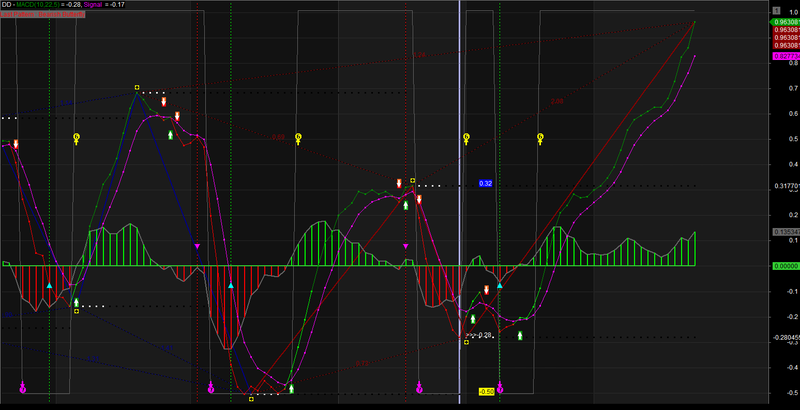
MACD with many features.
Screenshots
Indicator / Formula
Copy & Paste Friendly
_SECTION_BEGIN("MACD");
r= MACD(10, 22);
W1=ValueWhen(HHV(r,14),r,2);
dd= Signal(10,22,5);
mycolor = IIf(r<0 AND r>dd, colorBrightGreen,IIf(r>0 AND r>dd, colorGreen,IIf(r>0 AND r<dd,colorRed,colorRed)));
Plot(r,"MACD(10,22,5)",mycolor,styleDots);
Plot(dd,"Signal ",colorCustom12,styleDots);
histcolor = IIf((r-dd)-Ref((r-dd),-1)> 0, colorBrightGreen, colorRed);
Hist=r-dd;
Plot(0,"",34,styleLine+styleThick);
Plot( r-dd, "MACD Histogram", IIf(r-dd > 0,colorBrightGreen,colorRed ), styleNoTitle | ParamStyle("Histogram style",styleHistogram |styleThick| styleNoLabel, maskHistogram ));

Plot(MA((r-dd),1) ,"",31,styleLine+styleThick);

numbars = SelectedValue(Cum(Status("barvisible")));
fraction= IIf(StrRight(Name(),3) == "",3.2,3.2);
hts = Param ("Text Shift", -50,-100,100,10);
PlotText(">>>" + WriteVal(r,fraction),
SelectedValue(BarIndex())-(numbars/hts),SelectedValue(r),2);
SetChartBkColor( ParamColor("background",colorBlack));
Buy= Cross(MACD(10,22),Signal(10,22,5));
Sell = Cross( Signal(10, 22, 5), MACD(10,22) );

PlotShapes(IIf(Buy,shapeSmallSquare,shapeNone),colorGreen,0,r,Offset=-30);
PlotShapes(IIf(Buy,shapeSmallSquare,shapeNone),colorLime,0,r,Offset=-40);
PlotShapes(IIf(Buy,shapeUpArrow,shapeNone),colorWhite,0,r,Offset=-35);
PlotShapes(IIf(Sell,shapeSmallSquare,shapeNone),colorRed,0,r,Offset=30);
PlotShapes(IIf(Sell,shapeSmallSquare,shapeNone),colorOrange,0,r,Offset=40);
PlotShapes(IIf(Sell,shapeDownArrow,shapeNone),colorWhite,0,r,Offset=-35);


_SECTION_END();

_SECTION_BEGIN(" ZigZagTrend  ");
    array = Close;
    amount = Param("Amount", 4, 1, 50, 0.5 );
    zz0 = Zig( array, amount );
    zz1 = Ref( zz0, -1 );
    zz2 = Ref( zz0, -2 );
    tr = ValueWhen(zz0 > zz1 AND zz1 < zz2, zz1);
    pk = ValueWhen(zz0 < zz1 AND zz1 > zz2, zz1);
    PU = tr + 0.01 * abs(tr)*amount;
    PD = pk - 0.01 * abs(pk)*amount;
    ZZT = IIf( array >= PU AND zz0 > zz1, 1,
    IIf( array <= PD AND zz0 < zz1, -1, 0 ) );
    ZZT = ValueWhen( ZZT != 0, ZZT );

    // plot Zigzag and zigzag trend
    Plot( ZZT, "ZigZagTrend", colorGrey40, styleOwnScale|styleNoTitle );


    Buy = Cover = Cross( ZZT, 0 );
    Sell = Short = Cross( 0, ZZT );

PlotShapes(IIf(Cross( ZZT, 0 ),shapeDigit6,Null),colorYellow,0,Max(0,0),250);
PlotShapes(IIf(Cross( ZZT, 0 ),shapeUpArrow,Null),colorYellow,0,Max(0,0),240);

PlotShapes(IIf(Cross( 0, ZZT ),shapeDigit7,Null),colorCustom12,0,Min(0,0),-240);
PlotShapes(IIf(Cross( 0, ZZT ),shapeDownArrow,Null),colorCustom12,0,Min(0,0),230);

_SECTION_BEGIN("Gartley");
GBmin = Param("Swing B Min.",0.55,0.3,1,0.01);
GBmax = Param("Swing B Max.",0.72,0.4,1,0.01);
GCmin = Param("Swing C Min.",0.38,0.3,1.27,0.01);
GCmax = Param("Swing C Max.",1.0,0.4,1.27,0.01);
GDmin = Param("Swing D Min.(XA)",0.55,0.3,1,0.01);
GDmax = Param("Swing D Max.(XA)",1.0,0.4,1.0,0.01);

_SECTION_END();

_SECTION_BEGIN("Bat");

BatBmin = Param("Swing B Min.",0.38,0.3,1,0.01);
BatBmax = Param("Swing B Max.",0.55,0.4,1,0.01);
BatCmin = Param("Swing C Min.",0.38,0.3,1.62,0.01);
BatCmax = Param("Swing C Max.",1.27,0.4,1.62,0.01);
BatDmin = Param("Swing D Min.(XA)",0.5,0.3,1,0.01);
BatDmax = Param("Swing D Max.(XA)",1.0,0.4,1.0,0.01);

_SECTION_END();

_SECTION_BEGIN("Butterfly");
ToolTip=StrFormat("Open: %g\nHigh: %g\nLow: %g\nClose: %g (%.1f%%)\nVolume: "+NumToStr( V, 1 ), O, H, L, C, SelectedValue( ROC( C, 1 )));
BtBmin = Param("Swing B Min.",0.55,0.3,1,0.01);
BtBmax = Param("Swing B Max.",0.9,0.4,1,0.01);
BtCmin = Param("Swing C Min.",0.38,0.3,1.62,0.01);
BtCmax = Param("Swing C Max.",1.27,0.4,1.62,0.01);
BtDmin = Param("Swing D Min.(XA)",1,1,1.8,0.01);
BtDmax = Param("Swing D Max.(XA)",1.38,1,1.8,0.01);

_SECTION_END();

_SECTION_BEGIN("Crab");

CBmin = Param("Swing B Min.",0.38,0.3,1,0.01);
CBmax = Param("Swing B Max.",0.65,0.4,1,0.01);
CCmin = Param("Swing C Min.",0.38,0.3,1.62,0.01);
CCmax = Param("Swing C Max.",1.270,0.4,1.62,0.01);
CDmin = Param("Swing D Min.(XA)",1.25,1,1.8,0.01);
CDmax = Param("Swing D Max.(XA)",1.8,1,2,0.01);

_SECTION_END();

_SECTION_BEGIN("Patterns");

strength = Param("Strength",9,2,15,1);
bu = ParamToggle("Bullish Pattern","Off|On",1);
be = ParamToggle("Bearish Pattern","Off|On",1);

bi = Cum(1)-1;

function GetTop(bars)
{
Top =r== HHV(r,2*bars) AND Ref(HHV(r,bars),bars) < r;
Top = Top AND LastValue(bi)-ValueWhen(Top,bi) > bars;
return Top;
}

function GetValley(bars)
{
Valley = W1== LLV(W1,2*bars) AND Ref(LLV(W1,bars),bars) >W1;
Valley = Valley AND LastValue(bi)-ValueWhen(Valley,bi) > bars;
return Valley;
}


// Build fractals array

P1 = GetTop(strength);
V1 = GetValley(Strength);

P1 = IIf(P1,IIf(ValueWhen(P1,bi,2) < ValueWhen(V1,bi),P1,IIf(ValueWhen(P1,r,2) >r,False,P1)),P1);
//P1 = IIf(P1 AND ValueWhen(P1,bi,0) > bi,IIf(ValueWhen(P1,bi,0) < ValueWhen(V1,bi,0),IIf(ValueWhen(P1,r,0) >=r,False,P1),P1),P1);
P1 = IIf(P1 AND ValueWhen(P1,bi,0) > bi AND NOT(ValueWhen(V1,bi,0) > 0 AND ValueWhen(V1,bi,0)<ValueWhen(P1,bi,0)),IIf(ValueWhen(P1,r)<=ValueWhen(P1,r,0), False,P1),P1);


V1 = IIf(V1,IIf(ValueWhen(V1,bi,2) < ValueWhen(P1,bi),V1,IIf(ValueWhen(V1,W1,2)<W1,False,V1)),V1);
//V1 = IIf(V1 AND ValueWhen(V1,bi,0) > bi ,IIf(ValueWhen(V1,bi,0) < ValueWhen(P1,bi,0),IIf(ValueWhen(V1,W1,0) <= W1, False,V1),V1),V1);
V1 = IIf(V1 AND ValueWhen(V1,bi,0) > bi AND NOT(ValueWhen(P1,bi,0) > bi AND ValueWhen(P1,bi,0)<ValueWhen(V1,bi,0)) , IIf(ValueWhen(V1,W1)>=ValueWhen(V1,W1,0),False,V1),V1);


P1H1 = ValueWhen(P1,r);
P1Bar1 = ValueWhen(P1,bi);
P1H2 = ValueWhen(P1,r,2);
P1Bar2 = ValueWhen(P1,bi,2);
V1L1 = ValueWhen(V1,W1);
V1Bar1 = ValueWhen(V1,bi);
V1L2 = ValueWhen(V1,W1,2);
V1Bar2 = ValueWhen(V1,bi,2);


//Bullish Patterns

PTvalid = (P1Bar1 > V1Bar1 AND V1Bar1 > P1Bar2 AND P1bar2 > V1Bar2) AND P1; // Peaks and troughs are in order

// 4 swings of developing Gartley/Bat etc.

BullGartley4 = PTvalid AND (P1H2-V1L1)/(P1H2-V1L2) > GBmin AND (P1H2-V1L1)/(P1H2-V1L2) < GBmax
AND (P1H1-V1L1)/(P1H2-V1L1) > GCMin AND (P1H1-V1L1)/(P1H2-V1L1) < GCMax;

BullBat4 = PTvalid AND (P1H2-V1L1)/(P1H2-V1L2) > BatBmin AND (P1H2-V1L1)/(P1H2-V1L2) < BatBmax
AND (P1H1-V1L1)/(P1H2-V1L1) > BatCMin AND (P1H1-V1L1)/(P1H2-V1L1) < BatCMax;

BullButterfly4 = PTvalid AND (P1H2-V1L1)/(P1H2-V1L2) > BtBmin AND (P1H2-V1L1)/(P1H2-V1L2) < BtBMax
AND (P1H1-V1L1)/(P1H2-V1L1) > BtCmin AND (P1H1-V1L1)/(P1H2-V1L1) < BtCmax;

BullCrab4 = PTvalid AND (P1H2-V1L1)/(P1H2-V1L2) >CBmin AND (P1H2-V1L1)/(P1H2-V1L2) < CBmax
AND (P1H1-V1L1)/(P1H2-V1L1) > CCmin AND (P1H1-V1L1)/(P1H2-V1L1) < CCmax;


// Bullish Gartley/Bat found. D retacement level is not evaluated

BullGartley = IIf(LowestSince(BullGartley4,W1) < ValueWhen(BullGartley4,P1H2)-(ValueWhen(BullGartley4,P1H2)-ValueWhen(BullGartley4,V1L2))*GDmin AND
LowestSince(bullGartley4,W1) > ValueWhen(BullGartley4,P1H2)-(ValueWhen(BullGartley4,P1H2)-ValueWhen(BullGartley4,V1L2))*GDmax AND
HighestSince(BullGartley4,r) <= ValueWhen(BullGartley4,P1H1 ) AND
LowestSince(bullGartley4,W1)==W1, True,False);
BullGartley = BullGartley AND LowestSince(BullGartley4,W1) < ValueWhen(BullGartley4,V1L1);

BullBat = IIf(LowestSince(BullBat4,W1) < ValueWhen(BullBat4,P1H2)-(ValueWhen(BullBat4,P1H2)-ValueWhen(BullBat4,V1L2))*BatDmin AND
LowestSince(BullBat4,W1) > ValueWhen(BullBat4,P1H2)-(ValueWhen(BullBat4,P1H2)-ValueWhen(BullBat4,V1L2))*BatDmax AND
HighestSince(BullBat4,r) <= ValueWhen(BullBat4,P1H1 ) AND
LowestSince(BullBat4,W1)==W1, True,False);
BullBat = BullBat AND LowestSince(BullCrab4,W1) < ValueWhen(BullCrab4,V1L1);


BullCrab = IIf(LowestSince(BullCrab4,W1) < ValueWhen(BullCrab4,P1H2)-(ValueWhen(BullCrab4,P1H2)-ValueWhen(BullCrab4,V1L2))*CDmin AND
LowestSince(BullCrab4,W1) > ValueWhen(BullCrab4,P1H2)-(ValueWhen(BullCrab4,P1H2)-ValueWhen(BullCrab4,V1L2))*CDmax AND
HighestSince(BullCrab4,r) <= ValueWhen(BullCrab4,P1H1 ) AND
LowestSince(bullGartley4,W1)==W1, True,False);
BullCrab = BullCrab AND LowestSince(BullCrab4,W1) < ValueWhen(BullCrab4,V1L2);


BullButterfly = IIf(LowestSince(BullButterfly4,W1) < ValueWhen(BullButterfly4,P1H2)-(ValueWhen(BullButterfly4,P1H2)-ValueWhen(BullButterfly4,V1L2))*BtDMin AND
LowestSince(BullButterfly4,W1) > ValueWhen(BullButterfly4,P1H2)-(ValueWhen(BullButterfly4,P1H2)-ValueWhen(BullButterfly4,V1L2))*BtDmax AND
HighestSince(BullButterfly4,r) <= ValueWhen(BullButterfly4,P1H1 ) AND
LowestSince(bullButterfly4,W1)==W1, True,False);
BullButterfly = BullButterfly AND LowestSince(BullButterfly4,W1) < ValueWhen(BullButterfly4,V1L2);


// to remove redumbdent lines

BullHar4 = BullGartley4 OR BullButterfly4 OR BullBat4 OR BullCrab4 ;
BullHar = BullGartley OR BullButterfly OR BullBat OR BullCrab ;

Point4 = IIf(BullHar,ValueWhen(BullHar4,bi),Null);
BullHar = IIf(BullHar, IIf(Point4 == ValueWhen(BullHar,point4,0) AND ValueWhen(BullHar,bi,0) > bi ,False,BullHar),BullHar);

X = ValueWhen(BullHar4,V1L2);
Xbar = ValueWhen(BullHar4,V1Bar2);
A = ValueWhen(BullHar4,P1H2);
Abar = ValueWhen(BullHar4,P1bar2);
B = ValueWhen(BullHar4,V1L1);
Bbar = ValueWhen(BullHar4,V1bar1);
C1 = ValueWhen(BullHar4,P1H1);
C1bar = ValueWhen(BullHar4,P1bar1);
D = ValueWhen(BullHar,W1);
Dbar = ValueWhen(BullHar,bi);
ABdXA = (A-B)/(A-X);
BCdAB = (C1-B)/(A-B);
ADdXA = (A-D)/(A-X);
BCdCD = (C1-D)/(C1-B);

PlotPattern = Dbar > C1bar;
if(LastValue(PlotPattern) AND bu)
{
Plot( LineArray(LastValue(Xbar),LastValue(X),LastValue(Abar),LastValue(A)),"",colorDarkBlue,styleThick);
Plot(LineArray(LastValue(Abar),LastValue(A),LastValue(Bbar),LastValue(B)),"",colorDarkBlue,styleThick);
Plot(LineArray(LastValue(Bbar),LastValue(B),LastValue(C1bar),LastValue(C1)),"" ,colorDarkBlue,styleThick);
Plot(LineArray(LastValue(C1bar),LastValue(C1),LastValue(Dbar),LastValue(D)),"" ,colorDarkBlue,styleThick);
Plot(LineArray(LastValue(Xbar),LastValue(X),LastValue(Bbar),LastValue(B)),"",colorDarkBlue,styleDashed);
Plot(LineArray(LastValue(Xbar),LastValue(X),LastValue(Abar),LastValue(A)),"",colorDarkBlue,styleThick);
Plot(LineArray(LastValue(Abar),LastValue(A),LastValue(C1bar),LastValue(C1)),"" ,colorDarkBlue,styleDashed);
Plot(LineArray(LastValue(Bbar),LastValue(B),LastValue(Dbar),LastValue(D)),"",colorDarkBlue,styleDashed);
Plot(LineArray(LastValue(Xbar),LastValue(X),LastValue(Dbar),LastValue(D)),"",colorDarkBlue,styleDashed);

PlotText(NumToStr(LastValue(ABdXA),1.2),(LastValue(Bbar)+LastValue(Xbar))/2,(LastValue(B)+LastValue(X))/2,colorDarkBlue);
PlotText(NumToStr(LastValue(BCdAB),1.2),(LastValue(C1bar)+LastValue(Abar))/2,(LastValue(C1)+LastValue(A))/2,colorDarkBlue);
PlotText(NumToStr(LastValue(ADdXA),1.2) ,(LastValue(Dbar)+LastValue(Xbar))/2,(LastValue(D)+LastValue(X))/2,colorDarkBlue);
PlotText(NumToStr(LastValue(BCdCD),1.2),(LastValue(Bbar)+LastValue(Dbar))/2,(LastValue(B)+LastValue(D))/2,colorDarkBlue);
}

// Bearish Patterns

PTvalid = (V1Bar1 > P1Bar1 AND P1Bar1 > V1Bar2 AND V1Bar2 > P1Bar2) AND V1;

// Swing 4

BearGartley4 = PTvalid AND (P1H1-V1L2)/(P1H2-V1L2) > GBmin AND (P1H1-V1L2)/(P1H2-V1L2) < GBmax AND
(P1H1-V1L1)/(P1H1-V1L2) > GCmin AND (P1H1-V1L1)/(P1H1-V1L2) < GCmax;

BearBat4 = PTvalid AND (P1H1-V1L2)/(P1H2-V1L2) > BatBmin AND (P1H1-V1L2)/(P1H2-V1L2) < BatBmax AND
(P1H1-V1L1)/(P1H1-V1L2) > BatCmin AND (P1H1-V1L1)/(P1H1-V1L2) < BatCmax;

BearButterfly4 = PTvalid AND (P1H1-V1L2)/(P1H2-V1L2) > BtBmin AND (P1H1-V1L2)/(P1H2-V1L2) < BtBmax AND
(P1H1-V1L1)/(P1H1-V1L2) > BtCmin AND (P1H1-V1L1)/(P1H1-V1L2) < BtCmax;

BearCrab4 = PTvalid AND (P1H1-V1L2)/(P1H2-V1L2) > CBmin AND (P1H1-V1L2)/(P1H2-V1L2) < CBmax AND
(P1H1-V1L1)/(P1H1-V1L2) > CCmin AND (P1H1-V1L1)/(P1H1-V1L2) < CCmax;

// Poin D

BearGartley = IIf(HighestSince(bearGartley4,r) > ValueWhen(BearGartley4,V1L2) + (ValueWhen(BearGartley4,P1H2) - ValueWhen(BearGartley4,V1L2))*GDmin AND
HighestSince(bearGartley4,r) < ValueWhen(BearGartley4,V1L2) + (ValueWhen(BearGartley4,P1H2) - ValueWhen(BearGartley4,V1L2))*GDMax AND
LowestSince(BearGartley4,W1) >= ValueWhen(BearGartley4,V1L1 ) AND
HighestSince(BearGartley4,r) ==r, True, False);
BearGartley = BearGartley AND HighestSince(BearGartley4,r) > ValueWhen(BearGartley4,P1H1);

BearBat = IIf((HighestSince(BearBat4,r) > ValueWhen(BearBat4,V1L2) + (ValueWhen(BearBat4,P1H2) - ValueWhen(BearBat4,V1L2))*BatDmin AND
HighestSince(BearBat4,r) < ValueWhen(BearBat4,V1L2) + (ValueWhen(BearBat4,P1H2) - ValueWhen(BearBat4,V1L2))*BatDMax AND
LowestSince(BearBat4,W1) >= ValueWhen(BearBat4,V1L1 ) AND
HighestSince(BearBat4,r) == r), True, False);
BearBat = BearBat AND HighestSince(BearBat4,r) > ValueWhen(BearBat4,P1H1);

BearButterfly = IIf(HighestSince(BearButterfly4,r) > ValueWhen(BearButterfly4,V1L2) + (ValueWhen(BearButterfly4,P1H2) - ValueWhen(BearButterfly4,V1L2))*BtDmin AND
HighestSince(BearButterfly4,r) < ValueWhen(BearButterfly4,V1L2) + (ValueWhen(BearButterfly4,P1H2) - ValueWhen(BearButterfly4,V1L2))*BtDMax AND
LowestSince(BearButterfly4,W1) >= ValueWhen(BearButterfly4,V1L1 ) AND
HighestSince(BearButterfly4,r) == r, True, False);
BearButterfly = BearButterfly AND HighestSince(BearButterfly4,r) > ValueWhen(BearButterfly4,P1H2);

BearCrab = IIf(HighestSince(BearCrab4,r) > ValueWhen(BearCrab4,V1L2) + (ValueWhen(BearCrab4,P1H2) - ValueWhen(BearCrab4,V1L2))*CDmin AND
HighestSince(BearCrab4,r) < ValueWhen(BearCrab4,V1L2) + (ValueWhen(BearCrab4,P1H2) - ValueWhen(BearCrab4,V1L2))*CDMax AND
LowestSince(BearCrab4,W1) >= ValueWhen(BearCrab4,V1L1 ) AND
HighestSince(BearCrab4,r) ==r, True, False);
BearCrab =BearCrab AND HighestSince(BearCrab4,r) > ValueWhen(BearCrab4,P1H2);


BearHar4 = BearGartley4 OR BearButterfly4 OR BearBat4 OR BearCrab4 ;
BearHar = BearGartley OR BearButterfly OR BearBat OR BearCrab ;

Point4 = IIf(BearHar,ValueWhen(BearHar4,bi),Null);
BearHar = IIf(BearHar, IIf(Point4 == ValueWhen(BearHar,point4,0) AND ValueWhen(BearHar,bi,0) > bi ,False,BearHar),BearHar);

X = ValueWhen(BearHar4,P1H2);
Xbar = ValueWhen(BearHar4,P1Bar2);
A = ValueWhen(BearHar4,V1L2);
Abar = ValueWhen( BearHar4,V1bar2);
B = ValueWhen(BearHar4,P1H1);
Bbar = ValueWhen(BearHar4,P1bar1);
C1 = ValueWhen(BearHar4,V1L1);
C1bar = ValueWhen(BearHar4,V1bar1);
D = ValueWhen(BearHar,r);
Dbar = ValueWhen(BearHar,bi);

ABdXA = (B-A)/(X-A);
BCdAB = (B-C1)/(B-A);
ADdXA = (D-A)/(X-A);
BCdCD = (D-C1)/(B-C1);

PlotPattern = Dbar > C1bar;

if(LastValue(Plotpattern) AND be)

{
Plot( LineArray(LastValue(Xbar),LastValue(X),LastValue(Abar),LastValue(A)),"",colorDarkRed,styleThick);
Plot(LineArray(LastValue(Abar),LastValue(A),LastValue(Bbar),LastValue(B)),"",colorDarkRed,styleThick);
Plot(LineArray(LastValue(Bbar),LastValue(B),LastValue(C1bar),LastValue(C1)),"" ,colorDarkRed,styleThick);
Plot(LineArray(LastValue(C1bar),LastValue(C1),LastValue(Dbar),LastValue(D)),"" ,colorDarkRed,styleThick);
Plot(LineArray(LastValue(Xbar),LastValue(X),LastValue(Bbar),LastValue(B)),"",colorDarkRed,styleDashed);
Plot(LineArray(LastValue(Xbar),LastValue(X),LastValue(Abar),LastValue(A)),"",colorDarkRed,styleThick);
Plot(LineArray(LastValue(Abar),LastValue(A),LastValue(C1bar),LastValue(C1)),"" ,colorDarkRed,styleDashed);
Plot(LineArray(LastValue(Bbar),LastValue(B),LastValue(Dbar),LastValue(D)),"",colorDarkRed,styleDashed);
Plot(LineArray(LastValue(Xbar),LastValue(X),LastValue(Dbar),LastValue(D)),"",colorDarkRed,styleDashed);

PlotText(NumToStr(LastValue(ABdXA),1.2),(LastValue(Bbar)+LastValue(Xbar))/2,(LastValue(B)+LastValue(X))/2,colorDarkRed);
PlotText(NumToStr(LastValue(BCdAB),1.2),(LastValue(C1bar)+LastValue(Abar))/2,(LastValue(C1)+LastValue(A))/2,colorDarkRed);
PlotText(NumToStr(LastValue(BCdCD),1.2) ,(LastValue(Dbar)+LastValue(Bbar))/2,(LastValue(D)+LastValue(B))/2,colorDarkRed);
PlotText(NumToStr(LastValue(ADdXA),1.2) ,(LastValue(Dbar)+LastValue(Xbar))/2,(LastValue(D)+LastValue(X))/2,colorDarkRed);

}

LatPattern = bullHar OR bearHar;
Lastpattern = LastValue(ValueWhen(LatPattern,IIf(BullGartley,1,IIf(BearGartley,-1,IIf(BullBat,2,IIf(BearBat,-2,
IIf(BullButterfly,3,IIf(BearButterfly,-3,IIf(BullCrab,4,IIf(BearCrab,-4,Null))))))))));
PatternName = WriteIf(LastPattern == 1,"Bullish Gartley",WriteIf(LastPattern == -1,"Bearish Gartley",WriteIf(LastPattern == 2,"Bullish Bat",
WriteIf(LastPattern == -2,"Bearish Bat",WriteIf(LastPattern == 3,"Bullish Butterfly",WriteIf(LastPattern == -3,"Bearish Butterfly",
WriteIf(LastPattern == 4,"Bullish Crab",WriteIf(LastPattern == -4,"Bearish Crab","None"))))))));


plotFractals = ParamToggle("Plot Fractals","Off|On",0);
if(PlotFractals)
{
PlotShapes(shapeSmallCircle*P1,colorRed,0,r,10);
PlotShapes(shapeSmallCircle*V1,colorBlue,O,W1,-10);
}
RF=ValueWhen(P1,r);
SF=ValueWhen(V1,W1);
cbar = Param("cbar",4,2,50,1);
RF1 = IIf(RF AND BarsSince(P1) <=cbar,RF,Null);
SF1 = IIf(SF AND BarsSince(V1) <=cbar,SF,Null);
Plot(RF1,"",colorWhite,styleDots | styleNoLine);
Plot(SF1,"",colorWhite,styleDots | styleNoLine);
Plot(RF,"",colorBlack,40+16);
Plot(SF,"",colorBlack,40+16);
PlotShapes(IIf(P1, shapeSmallSquare,shapeNone),colorYellow,0,r,10);
PlotShapes(shapeSmallCircle*P1,colorBlack,0,r,10);
PlotShapes(IIf(V1, shapeSmallSquare,shapeNone),colorYellow,0,W1,-10);
PlotShapes(shapeSmallCircle*V1,colorBlack,0,W1,-10);
numbars = SelectedValue(Cum(Status("barvisible")));
fraction= IIf(StrRight(Name(),3) == "",3.2,3.2);
hts = Param ("Text Shift", -50,-100,100,10);
PlotText(">>>" + WriteVal(r,fraction),
SelectedValue(BarIndex())-(numbars/hts),SelectedValue(C),2);
PlotText("" + WriteVal(RF,fraction),
SelectedValue(BarIndex()+2)-(numbars/hts),SelectedValue(RF),colorWhite,colorBlue);
PlotText("" + WriteVal(SF,fraction),
SelectedValue(BarIndex()+2)-(numbars/hts),SelectedValue(SF),colorBlack,colorYellow);
GfxSetTextColor(IIf(LastPattern > 0, colorGreen,colorRed));
GfxTextOut("Last Pattern : " + PatternName,0,20);

_SECTION_BEGIN("MACD Divergence");


// Parameters
PeriodEMA = 13;
MACDIndicatorRange = 50;

// Volume filter
VolumeFilter = Param( "Volume MA filter", 100000, 50000, 500000, 100000 );
Timeframe = Interval(2);

// Adjust for weekly if necessary
if( Timeframe == "5-day" || Timeframe == "Weekly" ) {
  VolumeFilter  = VolumeFilter * 5;
}
else if( Timeframe == "Monthly") {
  VolumeFilter = VolumeFilter * 20;
}
else if( Timeframe != "Daily" ) {
  VolumeFilter = 0;
}

// Minimum number of bars required to form a divergence pattern. For a
// positive divergence, this is the number of falling bars in the context
// of a rising MACD or MACD-H pattern. Vice versa for negative divergence
MACDDivMinWidth = Param("Divergence min width", 4, 1, 10, 1 );

// Minimum width of negative projecting wave between two positive MACD-H waves,
// otherwise two positive waves will be considered as one single wave. This
// minimises invalid divergences, to ensure that "back of bears is broken".
// The same applies for a positive wave between two negative waves.
HistMinWidth = Param("Histogram min width", 4, 1, 10, 1 );


PeriodEMA = Optimize( "PeriodEMA ", 13, 5, 23, 1 );

// Other parameters
OpenPositions = 10;
ATRPeriod = 5;
InitialCapital = 100000;

PeriodFast = Param( "Fast EMA", 12, 2, 200, 1 );
PeriodSlow = Param( "Slow EMA", 26, 2, 200, 1 );
PeriodSignal = Param( "Signal EMA", 9, 2, 200, 1 );
MACDInd = MACD(PeriodFast, PeriodSlow );
SigInd = Signal(PeriodFast, PeriodSlow , PeriodSignal );
HistInd = MACDInd - SigInd ;
_N( macdStr = WriteVal( PeriodFast, 1.0 )+","+WriteVal( PeriodSlow , 1.0 ) );
_N( sigStr = macdStr + ","+WriteVal( PeriodSignal , 1.0 ) );

// Get displayed min and max value of MACD and MACD-H, to rescale it for better visibility
scMACDMax = LastValue(HHV(Max(MACDInd, sigInd),
                  BarsSince( Status("barvisible") AND NOT Ref(Status("barvisible"),-1) )));
scMACDMin = LastValue(LLV(Min(MACDInd, sigInd),
                  BarsSince( Status("barvisible") AND NOT Ref(Status("barvisible"),-1) )));
scaleMACD = Max( abs(scMACDMax), abs(scMACDMin) );

scHistMax = LastValue(HHV(HistInd,
            BarsSince( Status("barvisible") AND NOT Ref(Status("barvisible"),-1) )));
scHistMin = LastValue(LLV(HistInd,
            BarsSince( Status("barvisible") AND NOT Ref(Status("barvisible"),-1) )));
scaleHist = Max( abs(scHistMax), abs(scHistMin) );

 ;


// If current symbol is NOT an index, compare volume MA to filter limit
VolumeMA = MA( V, 50 );
if( IsIndex() ) {
  VolumeMABool = True;
}
else {
  VolumeMABool = IsTrue( VolumeMA > VolumeFilter );
}

// Get MACD-H, EMA, Stochastics and RSI arrays
DayHist = MACD( PeriodFast, PeriodSlow ) -
          Signal( PeriodFast, PeriodSlow, PeriodSignal );
DayEMA = EMA( Close, PeriodEMA );
DaySTO = StochK( 14 );
DayRSI = RSI( 14 );
DayBuyBool = IsTrue(
                ( // DayEMA > Ref(DayEMA,-1)  // EMA rising
                  DaySTO < 70                 // STO not overbought
                  // AND DayRSI > Ref(DayRSI,-1) // RSI rising
                  AND MACD( PeriodFast, PeriodSlow ) < 0 )
                OR Timeframe == "5-day" OR Timeframe == "Weekly"
              );
DaySellBool = IsTrue(
                ( // DayEMA < Ref(DayEMA,-1)  // EMA falling
                  DaySTO > 30                 // STO not oversold
                  // AND DayRSI < Ref(DayRSI,-1) // RSI falling
                  AND MACD( PeriodFast, PeriodSlow ) > 0 )
                OR Timeframe == "5-day" OR Timeframe == "Weekly"
              );


//--------------------------
// Positive MACD divergences
//--------------------------

// Get array containing for each element, when the MACD's lowest
// value occur, within the specified number of bars
MACDLowBars = LLVBars( MACDInd, MACDDivMinWidth );

// Get array defining if the MACD's previous bar was the
// minimum, AND if that MACD value < 0
MACDMinCond = MACDLowBars > 0 AND
        Ref(MACDLowBars,-1) == 0 AND
        Ref(MACDInd,-1) < 0;

// Get array containing MACD low bar values where lows
// occured, all other bars filled with 0
MACDLowVal = IIf( MACDMinCond , Ref(MACDInd,-1), 0 );

// Get array containing MACD low bar value at bar where MACD
// low occured, all other bars filled with preceding MACD
// low value (chandelier)
MACDLowSteps = ValueWhen( Ref(MACDMinCond,0),
                          Ref(MACDInd,-1), 1 );

// Get array containing price low bar values where lows
// occured, all other bars filled with huge number
PriceMACDLowVal = IIf( MACDMinCond,
                       Ref(LLV(L,MACDDivMinWidth ),-1),
                       2000000 );

// Get array containing local price low bar value at bar
// where MACD low occured, all other bars filled with preceding
// price low value (chandelier)
PriceMACDLowSteps = ValueWhen( Ref(MACDMinCond ,0),
                               LLV(L,MACDDivMinWidth ) );

// Get array containing differences in MACD low bar values
MACDLowDiffs = MACDLowSteps - Ref(MACDLowSteps,-1);

// Get array containing differences in price low bar values
PriceMACDLowDiffs = PriceMACDLowSteps - Ref(PriceMACDLowSteps,-1);

// Get array defining positive divergences
MACDLowBarDiffs = Ref( BarsSince(MACDMinCond ), -1 );

// Divergence signal
MACDPosDivergence = // MACDLowDiffs > 0 AND
         MACDLowVal < 0
         AND MACDLowVal > LLV(MACDLowVal, MACDIndicatorRange )
         AND PriceMACDLowVal < LLV(Ref(PriceMACDLowVal,-1), MACDIndicatorRange )
         AND PriceMACDLowDiffs < 0
         AND MACDLowBarDiffs < MACDIndicatorRange
         AND VolumeMABool
         AND C > 1.0
         // AND WeekBuyBool
         ;


//--------------------------
// Negative MACD divergences
//--------------------------

// Get array containing for each element, when the MACD's highest
// value occur, within the specified number of bars
MACDHighBars = HHVBars( MACDInd, MACDDivMinWidth );

// Get array defining if the MACD's previous bar was the
// maximum, AND if that MACD value > 0
MACDMaxCond = MACDHighBars > 0 AND
         Ref(MACDHighBars,-1) == 0 AND
         Ref(MACDInd,-1) > 0;

// Get array containing MACD high bar values where highs
// occured, all other bars filled with 0
MACDHighVal = IIf( MACDMaxCond,
                   Ref(MACDInd,-1), 0);

// Get array containing MACD high bar value at bar where MACD
// high occured, all other bars filled with preceding MACD
// high value (chandelier)
MACDHighSteps = ValueWhen( Ref(MACDMaxCond,0),
                           Ref(MACDInd,-1), 1 );

// Get array containing MACD high bar values where highs
// occured, all other bars filled with 0
PriceMACDHighVal = IIf( MACDMaxCond,
                        Ref(HHV(H,MACDDivMinWidth),-1),
                        0);

// Get array containing local price high bar value at bar
// where MACD high occured, all other bars filled with preceeding
// price high value (chandelier)
PriceMACDHighSteps = ValueWhen( Ref(MACDMaxCond,0),
                                HHV(H,MACDDivMinWidth) );

// Get array containing differences in MACD high bar values
MACDHighDiffs = MACDHighSteps - Ref(MACDHighSteps,-1);

// Get array containing differences in price high bar values
PriceMACDHighDiffs = PriceMACDHighSteps - Ref(PriceMACDHighSteps,-1);

// Get array defining negative divergences
MACDHighBarDiffs = Ref( BarsSince(MACDMaxCond), -1 );

// Divergence signal
MACDNegDivergence = // MACDHighDiffs < 0 AND
         MACDHighVal > 0
         AND PriceMACDHighVal > HHV( Ref(PriceMACDHighVal,-1), MACDIndicatorRange )
         AND MACDHighVal < HHV( MACDHighVal, MACDIndicatorRange )
         AND PriceMACDHighDiffs > 0
         AND MACDHighBarDiffs < MACDIndicatorRange
         AND VolumeMABool
         AND C > 1.0
         // AND WeekBuyBool
         ;


//------------------------------------
// Positive MACD Histogram divergences
//------------------------------------

// Get array containing when positive and negative and positive
// crossovers occured
HistPosCrossover = Cross( HistInd, 0 ) ;
HistNegCrossover = Cross( 0, HistInd ) ;
BarsSinceNegCross = BarsSince( HistNegCrossover );
BarsSincePosCross = BarsSince( HistPosCrossover );

// Get arrays containing for each element, when the MACD-H lowest
// values occur, within the specified number of bars
HistLowBars = LLVBars( HistInd, MACDDivMinWidth );

// Get array defining if the MACD-H previous bar was the minimum
// AND if that MACD-H value was < 0 or > 0
HistMinCond = HistLowBars > 0 AND
        BarsSinceNegCross >= HistLowBars AND
        Ref(HistLowBars,-1) == 0 AND
        Ref(HistInd,-1) < 0;

// Get array containing MACD-H  low bar values where lows
// occured, all other bars filled with 0
HistLowVal = IIf( HistMinCond , Ref(HistInd,-1), 0 );

// Get array containing MACD-H  low bar value at bar where MACD-H
// low occured, all other bars filled with preceding MACD-H
// low value (chandelier)
HistLowSteps =  ValueWhen( Ref(HistMinCond,0), Ref(HistInd,-1), 1 );

// Get array containing differences between MACD-H low bar value and the value
// at previous MACD-H zero positive crossing
// HistLowDiffs = HistLowSteps - ValueWhen( HistPosCrossover, HistLowSteps, 1 );
HistLowDiffs = HistLowSteps - Ref(HistLowSteps,-1);

// Get array containing MACD-H min value when MACD-H < 0, all other
// bars filled with 0
BarsSincePrevNegCross = ValueWhen( HistNegCrossover,
                                   Ref(BarsSinceNegCross ,-1), 1 );
BarsSinceWideNegCross = IIf( HistInd < 0 AND
                             BarsSincePosCross - BarsSinceNegCross <
                                 HistMinWidth,
                             BarsSincePrevNegCross + BarsSinceNegCross + 1,
                             BarsSinceNegCross  );
HistMinSteps = IIf( !BarsSinceWideNegCross,
                    HistInd,
                    LLV( HistInd , BarsSinceWideNegCross + 1) );

// Get array containing differences in MACD-H max bar values
HistMinDiffs = IIf( HistInd < 0,
                    HistMinSteps - Ref(HistMinSteps,-1),
                    0);

// Get minumum from previous MACD-H negative wave
// Plot( ValueWhen( HistNegCrossover, Ref(HistMinSteps,-1), 1 ),"PrevHistMinSteps-1", colorGreen );
// Plot( ValueWhen( HistNegCrossover, Ref(HistMinSteps,-1), 2 ),"PrevHistMinSteps-1", colorGreen );
PrevHistMinSteps = IIf( HistInd < 0 AND
                        BarsSincePosCross - BarsSinceNegCross <
                            HistMinWidth,
                        ValueWhen( HistNegCrossover,
                                   Ref(HistMinSteps,-1), 2 ),
                        ValueWhen( HistNegCrossover,
                                   Ref(HistMinSteps,-1), 1 ) );

// Get array containing price low bar values where lows
// occured, all other bars filled with huge number
PriceHistLowVal = IIf( HistMinCond,
                       Ref(LLV(L,MACDDivMinWidth),-1),
                       2000000 );

// Get array containing local price low bar value at bar
// where MACD-H low occured, all other bars filled with preceding
// price low value (chandelier)
PriceHistLowSteps = ValueWhen( Ref(HistMinCond ,0),
                               LLV(L,MACDDivMinWidth) );

// Get array containing differences in price low bar values
PriceHistLowDiffs = PriceHistLowSteps - Ref(PriceHistLowSteps,-1);

// Get array containing price low minimum value when MACD-H < 0,
// all other bars filled with 0
PriceHistMinSteps = IIf( !BarsSinceNegCross,
                          L,
                          LLV( L , BarsSinceNegCross) );

// Get minimum from previous MACD-H negative wave
PrevPriceHistMinSteps = IIf( BarsSincePosCross - BarsSinceNegCross <
                                HistMinWidth,
                             ValueWhen( HistNegCrossover,
                                        Ref(PriceHistMinSteps,-1), 2 ),
                             ValueWhen( HistNegCrossover,
                                        Ref(PriceHistMinSteps,-1), 1 ) );

// Divergence signal
HistPosDivergence = // HistLowDiffs > 0 AND
         // AND PriceHistLowDiffs < 0
         HistMinSteps > PrevHistMinSteps
         AND PriceHistMinSteps < PrevPriceHistMinSteps
         AND HistLowVal < 0
         AND VolumeMABool
         AND C > 1.0
         ;


//------------------------------------
// Negative MACD Histogram divergences
//------------------------------------

// Get arrays containing for each element, when the MACD-H highest values
// occur, within the specified number of bars
HistHighBars = HHVBars( HistInd, MACDDivMinWidth );

// Get array defining if the MACD-H previous bar was the maximum,
// AND if that MACD-H value was < 0 OR > 0
HistMaxCond = HistHighBars > 0
         AND BarsSincePosCross >=  HistHighBars
         AND Ref(HistHighBars,-1) == 0
         AND Ref(HistInd,-1) > 0
         ;

// Get array containing MACD-H high bar values where highs
// occured, all other bars filled with 0
HistHighVal = IIf( HistMaxCond, Ref(HistInd,-1), 0);

// Get array containing MACD-H high bar value at bar where MACD-H
// high occured, all other bars filled with preceding MACD-H
// high value (chandelier)
HistHighSteps = ValueWhen( Ref(HistMaxCond,0),
                           Ref(HistInd,-1), 1 );

// Get array containing differences in MACD-H high bar values
HistHighDiffs = HistHighSteps - Ref(HistHighSteps,-1);

// Get array containing MACD-H max value when MACD-H > 0, all other
// bars filled with 0
BarsSincePrevPosCross = ValueWhen( HistPosCrossover,
                                   Ref(BarsSincePosCross ,-1), 1 );
BarsSincePrevNegCross = ValueWhen( HistNegCrossover,
                                   Ref(BarsSinceNegCross ,-1), 1 );
BarsSinceWidePosCross = IIf( HistInd > 0 AND
                             BarsSinceNegCross - BarsSincePosCross <
                                HistMinWidth,
                             BarsSincePrevPosCross + BarsSincePosCross + 1,
                             BarsSincePosCross  );
HistMaxSteps = IIf( !BarsSinceWidePosCross,
                    HistInd,
                    HHV( HistInd , BarsSinceWidePosCross + 1) );

// Get array containing differences in MACD-H max bar values
HistMaxDiffs = IIf( HistInd > 0,
                    HistMaxSteps - Ref(HistMaxSteps,-1),
                    0);

// Get high from pevious MACD-H positive wave
PrevHistMaxSteps = IIf( HistInd > 0 AND
                        BarsSinceNegCross - BarsSincePosCross <
                            HistMinWidth,
                        ValueWhen( HistPosCrossover,
                                   Ref(HistMaxSteps,-1), 2 ),
                        ValueWhen( HistPosCrossover,
                                   Ref(HistMaxSteps,-1), 1 ) );

// Get array containing MACD-H high bar values where highs
// occured, all other bars filled with 0
PriceHistHighVal = IIf( HistMaxCond,
                        Ref(HHV(H,MACDDivMinWidth),-1),
                        0);

// Get array containing local price high bar value at bar
// where MACD-H high occured, all other bars filled with preceeding
// price high value (chandelier)
PriceHistHighSteps = ValueWhen( Ref(HistMaxCond,0),
                                HHV(H,MACDDivMinWidth) );

// Get array containing differences in price high bar values
PriceHistHighDiffs = PriceHistHighSteps - Ref(PriceHistHighSteps,-1);

// Get array containing MACD-H max value when MACD-H > 0, all other
// bars filled with 0
PriceHistMaxSteps = IIf( !BarsSincePosCross,
                         H,
                         HHV( H , BarsSincePosCross) );

// Get high from pevious MACD-H positive wave
PrevPriceHistMaxSteps = IIf( BarsSinceNegCross - BarsSincePosCross <
                                 HistMinWidth,
                             ValueWhen( HistPosCrossover,
                                        Ref(PriceHistMaxSteps,-1), 2 ),
                             ValueWhen( HistPosCrossover,
                                        Ref(PriceHistMaxSteps,-1), 1 ) );

// Divergence signal
HistNegDivergence = // HistHighDiffs < 0 AND
         // AND PriceHistHighDiffs > 0
         HistMaxSteps < PrevHistMaxSteps
         AND PriceHistMaxSteps > PrevPriceHistMaxSteps
         AND HistHighVal > 0
         AND VolumeMABool
         AND C > 1.0
         ;


//-----------------------
// MACD crossover signals
//-----------------------

PosCrossover = Cross( DayHist, 0 )
        AND DayBuyBool
        AND VolumeMABool
        AND C > 1.0
        ;
NegCrossover = Cross( 0, DayHist )
        AND DaySellBool
        AND VolumeMABool
        AND C > 1.0
        ;


// Plot signals
PlotShapes( IIf( HistPosDivergence , shapeSmallUpTriangle, shapeNone ),
            colorYellow, 0, 0 , -12  );
PlotShapes( IIf( HistNegDivergence , shapeSmallDownTriangle, shapeNone ),
            colorRed, 0, 0, -12  );


_SECTION_END();

_SECTION_BEGIN("MACD");
ml = MACD(6, 13);
dd= Signal(6,13,5);
Hist=ml-dd;
col_hist= IIf(Hist > BBandTop( Hist, 5, 0.5 ),colorLightBlue,IIf(Hist < BBandBot( Hist, 5, 0.5 ),colorBlue,colorRed));
pr=PeakBars(C,5)==0;
ps =TroughBars(C,5)==0;


PlotShapes(IIf(ps,shapeSmallUpTriangle,Null),colorCustom11,0,Min(0,0),-40);
PlotShapes(IIf(pr,shapeSmallDownTriangle,Null),colorCustom12,0,Min(0,0),-40);
Plot(ps,"",colorBrightGreen,styleHistogram|styleDashed|styleOwnScale|styleNoLabel,0,1,0,0);
Plot(pr,"",colorRed,styleHistogram|styleDashed|styleOwnScale|styleNoLabel,0,1,0,0);
1 comments
Leave Comment
Please login here to leave a comment.
Dear waeeldis,
am try to install ur MACD indicator, but the line 826, 827 showing error,
pls try to check and if u feel the error, pls solve, we happy to that.
-TIGER NIFTY.