SMI - Stochastic Momentum Index for Amibroker (AFL)
moapereira about 15 years ago Amibroker (AFL)
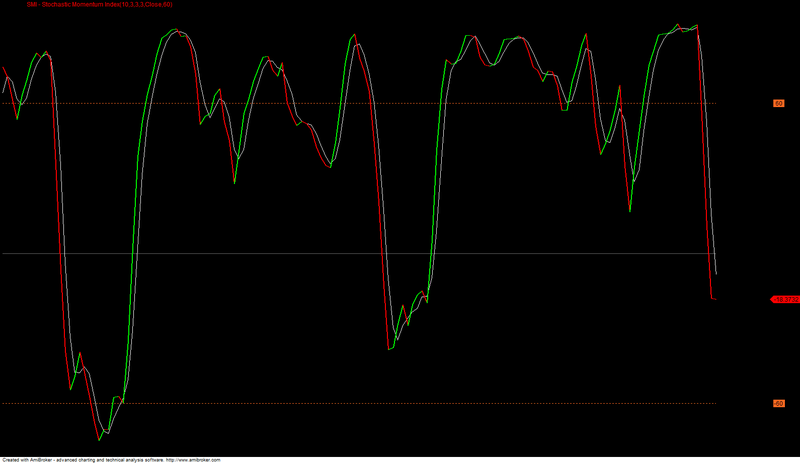
SMI was created by William Blau in January 1993 issue of Technical Analysis of Stocks & Commodities.
The result is an oscillator that ranges between +/- 100 and is a bit less erratic than an equal period Stochastic Oscillator.
The interpretation of the SMI is virtually identical to the Stochastic Oscillator.
Screenshots
Indicator / Formula
Copy & Paste Friendly
_SECTION_BEGIN("SMI - Stochastic Momentum Index");
SetChartBkColor( colorBlack ) ;
LookBack 	= Optimize("LookBack",Param("Lookback", 10, 1, 100 ),1,30,1);
Smooth1  	= Optimize("Smooth 1",Param("Smooth 1", 3, 1, 100 ),1,30,1);
Smooth2  	= Param("Smooth 2", 3, 1, 20 );
Trigger  	= Param("Signal", 3, 1, 10);
PP 		= ParamField("Price field",-1);
SMILevel 	= Param("Level", 60, 10, 60, 10);

HH = HHV( H, LookBack );
LL = LLV( L, LookBack );


StoMom = 100 * EMA( EMA( PP - 0.5 * ( HH + LL ), Smooth1 ), Smooth2 ) /
( 0.5 * EMA( EMA( HH - LL, Smooth1 ), Smooth2 ) );
StoSig = MA(StoMom,3);

Buy = Cover = Cross(StoMom,StoSig);
Short = Short = Cross(StoSig,StoMom);

Plot (StoMom,_DEFAULT_NAME(),IIf(StoMom> Ref(StoMom,-1),colorBrightGreen,colorRed), styleLine+styleThick);
Plot (StoSig,"",colorWhite,styleLine+styleNoLabel);
Plot(0,"",31,styleNoLabel);
Plot( SMILevel,"",colorOrange,styleDashed);
Plot(-SMILevel,"",colorOrange,styleDashed);
_SECTION_END();
2 comments
Leave Comment
Please login here to leave a comment.
Cool!
Tested on SPY for past 6 years resut.
Having more losers than winners.
Reverse the Buy/Sell & Short/Cover would bring positive result.
there are no buy sell signals. On what ground you tested the results? This is just an indicator, no signals… you have to change the parameters for better results.