True ADX/PDI/MDI v2.0 for Metastock
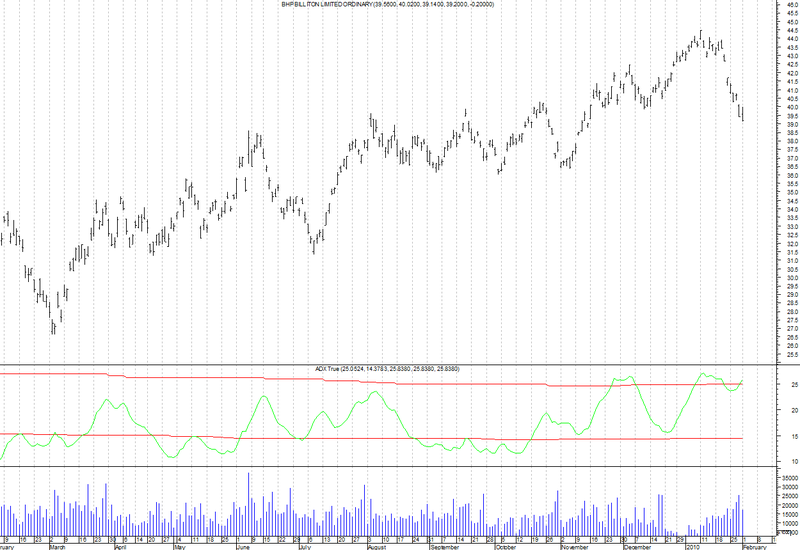
MetaStock’s native ADX plots erratic ADX values as periods are increased. e.g., compare this formula (50pds) to MS’s ADX.
By Jose Silva
Screenshots
Indicator / Formula
Copy & Paste Friendly
{ True ADX/PDI/MDI v2.0
  Incorporating automatic Support/Resistance.

 MetaStock's native ADX plots erratic ADX
  values as periods are increased. e.g.,
  compare this formula (50pds) to MS's ADX(50).

 Copyright � 2003-2008 Jose Silva.
 For personal use only.
 http://www.metastocktools.com }

{ User inputs }
pds:=Input("ADX periods",1,100,14);
plot:=Input("plot:  [1]ADX,  [2]PDI,  [3]MDI,  [4]All",1,4,1);

{ Variables }
Lo1:=Ref(L,-1);
Hi1:=Ref(H,-1);

{ Plus Directional Movement (PDI) }
condUp:=H>Hi1 AND L>=Lo1
 OR H>Hi1 AND L<Lo1 AND H-Hi1>Lo1-L;
PlusDM:=Wilders(condUp*(H-Hi1),pds)/ATR(pds)
 *100;

{ Minus Directional Movement (MDI) }
condDw:=H<=Hi1 AND L<Lo1
 OR H>Hi1 AND L<Lo1 AND H-Hi1<Lo1-L;
MinusDM:=Wilders(condDw*(Lo1-L),pds)/ATR(pds)
 *100;

{ True Average Directional Movement (ADX) }
DMdiff:=Abs(PlusDM-MinusDM);
DMsum:=Max(PlusDM+MinusDM,.000001);
ADXtrue:=100*Wilders(DMdiff/DMsum,pds);

{ Final plot }
x:=If(plot=2,PlusDM,If(plot=3,MinusDM,ADXtrue));

{ Automatic OverBought/Sold historical levels }
avg:=Cum(x)/Cum(IsDefined(x));
pk:=Ref(x,-1)=HHV(x,3) AND Ref(x,-1)>avg;
pk1:=ValueWhen(1,pk,Ref(x,-1))*pk;
oBought:=Cum(pk1)/Cum(pk);
tr:=Ref(x,-1)=LLV(x,3) AND Ref(x,-1)<avg;
tr1:=ValueWhen(1,tr,Ref(x,-1))*tr;
oSold:=Cum(tr1)/Cum(tr);

{ Plot in own window }
oBought;oSold;
If(plot=4,PlusDM,x);
If(plot=4,MinusDM,x);
If(plot=4,ADXtrue,x)
0 comments
Leave Comment
Please login here to leave a comment.