Stock Portfolio Organizer

The ultimate porfolio management solution.

Shares, Margin, CFD's, Futures and Forex
EOD and Realtime
Dividends and Trust Distributions
And Much More ....
For Portfolio Manager Click Here

WiseTrader Toolbox

#1 Selling Amibroker Plugin featuring:

Advanced Adaptive Indicators
Advanced Pattern Exploration
Neural Networks
And Much More ....
Find Out More Here

RSI ZERO LAG INDICATOR for Amibroker (AFL)

Rating:
4 / 5 (Votes 10)
Tags:
oscillator, amibroker

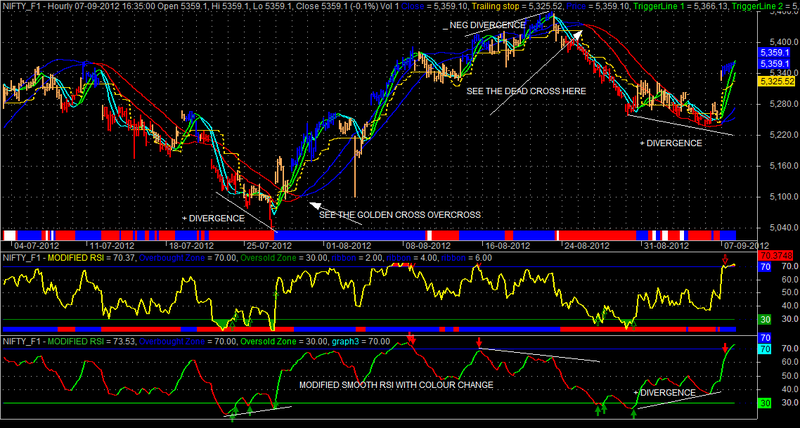
Hi friends as per your request i am posting the RSI indicator with zero lag and provided a buy and sell signal.The rsi parameters are changed to produce a bullish and bearish colour code.Always try to trade the divergences.Can be used in all timeframes.Hope you all enjoy and wishing you luck.
Prasad Muni

Screenshots

Similar Indicators / Formulas

Febo RSI ..real indicator
Submitted by abhinavsingh over 12 years ago
Trading Volume Statistic
Submitted by tuanstock1 over 9 years ago
Ergodic Oscillator
Submitted by dljtrader over 13 years ago
3 Days Track
Submitted by janet0211 almost 14 years ago
Chande Momentum Oscillator
Submitted by klimpek over 13 years ago

Indicator / Formula

Copy & Paste Friendly
_SECTION_BEGIN("MODIFIED RSI ");
SetChartBkColor(ParamColor("Panel color ",colorBlack));
RP = Param("RSI",14,2,20,1);
UL= Param("Upper Limit",70,0,100,1);
LL= Param("Lower Limit",30,0,100,1);
PlotGrid(UL,colorBlue);    
PlotGrid(LL,colorBlue); 
R= RSIa(C, RP);
Plot(R, "MODIFIED RSI",  colorLime, styleThick);

Overbought=70;
Oversold=30;
Plot(Overbought,"Overbought Zone",colorBlue);
Plot(Oversold,"Oversold Zone",colorGreen);

Overbought=70;
Oversold=30;
Buy = Cross(R, Oversold) AND R > Oversold;
Sell = Cross(Overbought, R) AND R < Overbought;

PlotShapes(IIf(Sell, shapeDownArrow , shapeNone), colorRed);
PlotShapes(IIf(Buy, shapeUpArrow , shapeNone), colorGreen); 

_SECTION_END();

MaxGraph=10;
Period1=Param("Period 1", 10, 5, 50, 1);
Period2=Param("Period 2", 10, 5, 50, 1);
EMA1= EMA(R,Period1);
EMA2= EMA(EMA1,Period2);
Difference= EMA1 - EMA2;
ZeroLagEMA= EMA1 + Difference;
PR=abs(ZeroLagEMA); 

Graph0=PR;

MoveAvg=MA(PR,5);  

// Graph1=MoveAvg;          Remove the // if you want a Crossover MA to plot
// Graph1Color=colorTan;

Graph0Style=4;
upbar= PR>= MoveAvg AND PR>= Ref(PR,-1) ;
downbar=(PR < MoveAvg) OR PR>= MoveAvg AND PR< Ref(PR,-1) ;
barcolor = IIf( downbar,colorRed, IIf( upbar, colorBrightGreen, 7));
Graph0BarColor = ValueWhen( barcolor != 0, barcolor );
Graph2=30;
Graph3=70;

Graph2Style=Graph3Style=Graph4Style=1;
Graph4Color=2;
Graph2Color=5;
Graph3Color=4;

6 comments

1. Muralikrishna

clear indicator for Devergens

thank u sir

2. xray27

good indicator

3. immu_syed@yahoo.com

how to use above coding which save extention and how input amibroker plz support me
thanks

7. immu_syed@yahoo.com

WHERE THE FORMULA AUTOMATIC BBUY SELL SIGNAL PLZ GIVE AND ALL PROCESS ADD FORMULA AND SETTING

8. anse

كيف اعدل هذه المعادلة لتعمل على ايمي بروكر ابليز

Indicator: RevEngRSI-EMA


{RevEng EMARSI}
inputs:
         EmaPeriod( 45 ),
         WildPeriod( 14) ;
variables:
         EmaRSI( 0 ),
         AUC(0),
         ADC(0),
         RevEngEmaRSI(0),
         X( 0 ) ;
EmaRSI = XAverage( RSI( Close,WildPeriod ), EmaPeriod);
Value1 = Iff( Close > Close[1], Close - Close[1], 0) ;
AUC = XAverage( Value1, WildPeriod ) ;
Value2 =Iff( Close[1] > Close, Close[1] - Close, 0 ) ;
ADC = XAverage( Value2, WildPeriod ) ;
X = ( WildPeriod - 1 )*( ADC * EmaRSI
 / ( 100 - EmaRSI ) - AUC ) ;
RevEngEMARSI = Iff( X >= 0, Close + X,
 Close + X * ( 100 - EmaRSI ) / EmaRSI ) ;
Plot1[-1]( RevEngEMARSI, "EmaRSI" ) ;
 
Indicator: RevEngRSI-SMA
 {RevEng SMARSI}
Inputs:
         SmaPeriod( 45 ),
         WildPeriod( 14 );
variables:
         SmaRSI( 0 ),
         AUC( 0 ),
         ADC( 0 ),
         X( 0 ),
         RevEngSmaRSI( 0 );
SmaRSI = Average( RSI( Close, WildPeriod), SmaPeriod-1);
Value1 = Iff( Close > Close[1], Close - Close[1], 0 ) ;
AUC = XAverage( Value1, WildPeriod ) ;
Value2 = Iff( Close[1] > Close, Close[1] - Close, 0 ) ;
ADC = XAverage( Value2, WildPeriod ) ;
X = ( WildPeriod - 1 ) * ( ADC * SmaRSI
 / ( 100 - SmaRSI ) - AUC ) ;
RevEngSMARSI = Iff( X >= 0, Close + X,
 Close + X * ( 100 - SmaRSI ) / SmaRSI ) ;
if CurrentBar > ( SmaPeriod ) then
         Plot1[-1] ( RevEngSMARSI, "SmaRSI" ) ;
9. ppaskawati

Buy/sell signal in RSI. Good indicator and very helpful. Thank you.

Leave Comment

Please login here to leave a comment.

Back