My Support and Target for Amibroker (AFL)
njethva almost 14 years ago Amibroker (AFL)
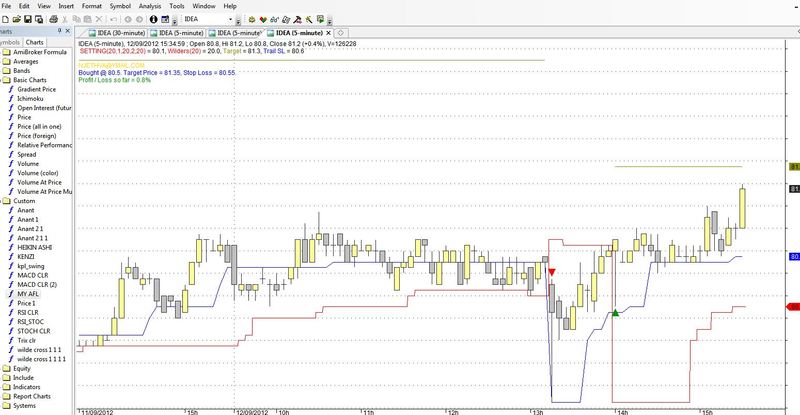
My AFl this gives good indication with SL and Target.
Enjoy freinds.
Screenshots
Indicator / Formula
Copy & Paste Friendly
_SECTION_BEGIN("SETTING");

SetChartOptions(0, chartShowDates | chartWrapTitle);

Type = ParamList("Average Type", "Wilders");
P = Param("Averaging Period", 20, 3, 100,1);
Q = Param("%Change", 1, 0.1, 10, 0.1);
BP = Param("BB Period", 20, 3, 100);
BW = Param("BB Width", 2, 0.5, 10, 0.5);
BBOption = ParamToggle("Plot BB", "No I Yes");

A=Param( "Swing", 20, 1, 100);
SL = Max(LLV(L, 5), Trough(L, Q, 1));

Tgt = 2 * H - SL;
MeanPrice = Prec((O + C) / 2, 2);

Part = 100 * (H - A) / (H - L);

BBTop = BBandTop(C, BP, BW);
BBBot = BBandBot(C, BP, BW);

res=HHV(H,A);
sup=LLV(L,A);
avd=IIf(C>Ref(res,-1),1,IIf(C<Ref(sup,-1),-1,0));
avn=ValueWhen(avd!=0,avd,1);
tsl=IIf(avn==1,sup,res);

// line code
Plot(tsl, _DEFAULT_NAME(), ParamColor( "ColorD", colorRed ), styleStaircase);

// arrows code
Buy=Cross(C,Ref(res,-1));
Sell=Cross(Ref(sup,-1),C);
Buy = ExRem(Buy, Sell);
Sell = ExRem(Sell, Buy);

Bought = Flip(Buy, Sell);
Sold = Flip(Sell, Buy);
NextTgt = ValueWhen(Buy, Tgt, 1);

for(i = 1; i < BarCount; i++)
        {
                if(Bought[i] AND NOT Buy[i])
                {
                        SL[i] = Max(SL[i], SL[i - 1]);
                        if(C[i - 1] >= 0.9999 * NextTgt[i - 1]) NextTgt[i] = Tgt[i - 1];
                        NextTgt[i] = Max(NextTgt[i], NextTgt[i - 1]);
                }
        }
BuyDate = ValueWhen(Buy, Ref(DateTime(), 1), 1);
BuyPrice = ValueWhen(Buy, Ref(MeanPrice, 1), 1);
SellPrice = ValueWhen(Sell, Ref(MeanPrice, 1), 1);

TgtReached = IIf(Bought AND NOT Buy AND C >= 0.9999 * NextTgt, True, False);
SLHit = IIf(Bought AND NOT Buy AND C < SL, True, False);
SLHit = ExRem(SLHit, Buy);
//
if(TgtReached[BarCount - 1]) NextTgt[BarCount - 1] = 2 * H[BarCount -1] - SL[BarCount - 1];
//
if(Status("action") == actionIndicator)
        {
                Ttl = EncodeColor(colorGold) + "NJETHVA@YMAIL.COM" + "\n"
                                               +  EncodeColor(colorBlue) + WriteIf(Bought AND NOT Buy, "Bought @ " + BuyPrice + ". "
                        + "Target Price = " + NextTgt + ", Stop Loss = " + SL + ".\n"
                        + WriteIf(TgtReached, "Target Reached. Next Target = " + Ref(NextTgt, 1) + ".\n", "")
                        + EncodeColor(colorGreen) + "Profit / Loss so far = " + Prec(100 * (C - BuyPrice) / BuyPrice, 2) + "%", "")
                        +EncodeColor(colorRed)+ WriteIf(Sold AND NOT Sell, "Sold @ " + SellPrice + "\nProfit / Loss in Previous Trade = " + Prec(100 * (SellPrice - BuyPrice) / BuyPrice, 2) + "%", "");

                _N(Title = StrFormat("{{NAME}} ({{INTERVAL}}), {{DATE}} ; {{OHLCX}}, V=%1.0f\n {{VALUES}}\n\n", V) + Ttl);
                ChartStyle = ParamStyle("Chart Type", styleBar, maskAll);

                PlotOHLC(O, H, L, C, "", colorDarkGrey, ChartStyle);
                Plot(A, Type + "(" + P +")", ParamColor( "ColorD", colorRed ), ParamStyle("StyleD"));
                Plot(IIf(Bought, NextTgt, Null), "Target", colorDarkYellow, styleLine);
                Plot(SL, "Trail SL", colorBlue, styleLine);
                PlotShapes(IIf(Buy, shapeUpTriangle, shapeNone),colorGreen, 0,L, Offset=-12);
                PlotShapes(IIf(Sell, shapeDownTriangle, shapeNone),colorRed, 0,H, Offset=-12);

                if(BBOption) Plot(BBtop, "BB-Top", colorPink, styleLine);
                if(BBOption) Plot(BBBot, "BB-Bot", colorPink, styleLine);
        }
2 comments
Leave Comment
Please login here to leave a comment.
error 74
No problems here with Amibroker 6.20.1