Stochastic OSCILLATOR HISTOGRAM for Amibroker (AFL)
prasadbrao almost 14 years ago Amibroker (AFL)
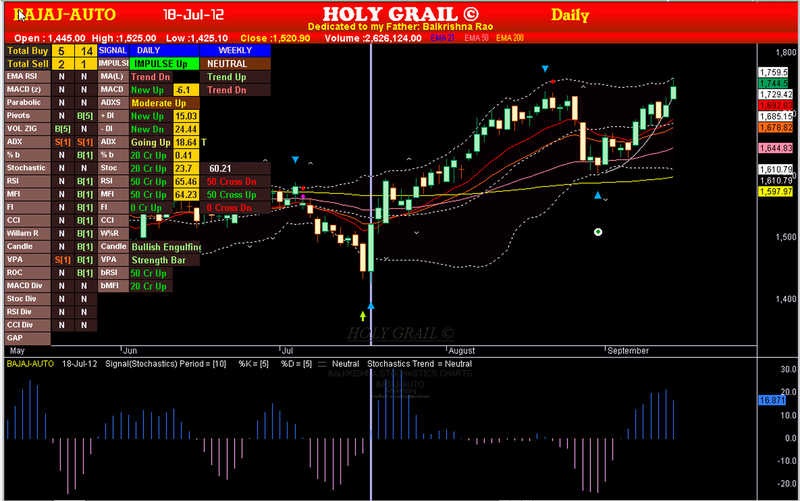
The Stoc Oscillator with Histogram
Screenshots
Indicator / Formula
Copy & Paste Friendly
_SECTION_BEGIN("BACK COLR");
_SECTION_BEGIN("PRASAD SYSTEMS");
Param("DEDICATED TO MY FATHER",5);
_SECTION_END();
GfxSetOverlayMode(1);
SetChartBkColor( ParamColor("Chart Color", colorBlack));
GfxSetOverlayMode(1);
GfxSelectFont("Tahoma", Status("pxheight")/20 ); /* Up down name*/
GfxSetTextAlign( 6 );// center alignment
GfxSetTextColor( ParamColor("Text Color", ColorHSB( 42, 42, 42 ) ));
GfxSetBkMode(0); // transparent
GfxTextOut( Name(), Status("pxwidth")/2, Status("pxheight")/7);
GfxSelectFont("Tahoma", Status("pxheight")/30 );
GfxTextOut( IndustryID(1), Status("pxwidth")/2, Status("pxheight")/5 );  /* Up Down Sector*/

GfxSelectFont("Tahoma", Status("pxheight")/40 );
GfxTextOut( "Feedback prasad9rao@gmail.com", Status("pxwidth")/2, Status("pxheight")/4);
GfxSelectFont("Tahoma", Status("pxheight")/20 );
GfxTextOut( " BALKRISHNA STOCHASTICS CHARTS ", Status("pxwidth")/2, Status("pxheight")/15 );


_SECTION_END();


/*************** remove all above lines for Amibroker 5.00 or less than 5


/**************************************************
                Stochastics
***************************************************/

SP = Param( "Periods", 10, 1, 200, 1 );
Ksmooth = Param( "%K avg", 5, 1, 200, 1 );
Dsmooth = Param( "%D avg", 5, 1, 200, 1 );
StochDval = StochD( SP , Ksmooth, DSmooth );
StochKval = StochK( SP , Ksmooth);

Overbought = 80;
Oversold = 20;


mycolorst =IIf(Stochkval- Stochdval<0,ColorRGB(248,170,255),IIf(Stochkval- Stochdval>0,ColorRGB(81,122,251),ColorRGB(125,84,11)));


Plot(Stochkval- Stochdval ,"",mycolorst ,styleHistogram);


StochBuy = Cross(StochK(SP,Ksmooth), StochD(SP,Ksmooth, DSmooth)) AND
(StochD(SP,Ksmooth, DSmooth) > 20) AND (StochK(SP,Ksmooth) > 20) AND
(StochD(SP,Ksmooth, DSmooth) < 80) AND (StochK(SP,Ksmooth) < 80);

StochSell = Cross (StochD(SP,Ksmooth, DSmooth), StochK(SP,Ksmooth)) AND
(StochD(SP,Ksmooth, DSmooth) > 20) AND (StochK(SP,Ksmooth) > 20) AND
(StochD(SP,Ksmooth, DSmooth) < 80) AND (StochK(SP,Ksmooth) < 80);

StochStrongBuy = Cross(StochK(SP,Ksmooth),StochD(SP,Ksmooth, DSmooth)) AND
(StochD(SP,Ksmooth, DSmooth) < 20) AND (StochK(SP,Ksmooth) < 20) ;

StochStrongSell = Cross (StochD(SP,Ksmooth,DSmooth), StochK(SP , Ksmooth));
(StochD(SP,Ksmooth, DSmooth) > 80) AND (StochK(SP,Ksmooth) > 80);

//****************** BULLISH / BEARISH *******************/
StochBull = StochK(SP , Ksmooth)>StochD(SP , Ksmooth, DSmooth) AND
(StochD(SP,Ksmooth, DSmooth) > 20) AND (StochK(SP,Ksmooth) > 20) AND
(StochD(SP,Ksmooth, DSmooth) < 80) AND (StochK(SP,Ksmooth) < 80);

StochBear = StochK(SP , Ksmooth)<StochD(SP , Ksmooth, DSmooth)AND
(StochD(SP,Ksmooth, DSmooth) > 20) AND (StochK(SP,Ksmooth) > 20) AND
(StochD(SP,Ksmooth, DSmooth) < 80) AND (StochK(SP,Ksmooth) < 80);


StochOB = (StochD(SP,Ksmooth, DSmooth) > 80) AND (StochK(SP,Ksmooth) > 80);
StochOS = (StochD(SP,Ksmooth, DSmooth) < 20) AND (StochK(SP,Ksmooth) < 20) ;

/****************************************************
                   CHART TITLES
****************************************************/


Title = EncodeColor(colorYellow)+  Title = Name() + "    " + EncodeColor(2) + Date()  + "    "


/********************STOChASTICS*********************/

+EncodeColor(colorWhite)+"Signal(Stochastics) "+EncodeColor(colorWhite)+"Period = "+"["+SP+"]"+"      %K = "+"["+Ksmooth+"]"+ "      %D = "+"["+Dsmooth+"]"+"   ::::   "

+ WriteIf(StochBuy,EncodeColor(colorBrightGreen)+"Buy",WriteIf(StochSell,EncodeColor(colorRed)+"Sell",

WriteIf(StochStrongBuy,EncodeColor(colorBrightGreen)+"Strong Buy",WriteIf(StochStrongSell,EncodeColor(colorRed)+"Strong Sell","Neutral"))))


+EncodeColor(colorWhite)+ "    " + "Stochastics Trend  = "
+WriteIf(StochBull,EncodeColor(colorBrightGreen)+"Bullish",WriteIf(StochBear,EncodeColor(colorRed)+"Bearish",
WriteIf(StochOS,EncodeColor(colorBrightGreen)+"OverSold",WriteIf(StochOB,EncodeColor(colorRed)+"OverBrought","Neutral"))));
3 comments
Leave Comment
Please login here to leave a comment.
Hi
Can you please share the above price chart afl also? It looks like very informative.
This is just a gentle request .
johnnypareek
hello sir
nice work iam impressed with the afl and a small request sir can u share the above afl holygrail,which i think will be usefull to take a call on stocks.if u r interested to share pls do it sir i will be thankfull
Hallo Sir Prasad Brao
Please, Could you share the price chart afl On Stochastic Oscillator Histogram ? It looks like very informative.
I believe Your Father will be proud if your idea will be used for many people for kindness.
I will be glad, if you could send in my email suseda.specialfx@yahoo.com
Thank you and pray.