COMPOSITE INDEX FOR THE GOLD AND SILVER TRADE for Amibroker (AFL)
prasadmuni almost 14 years ago Amibroker (AFL)
HI FRIENDS
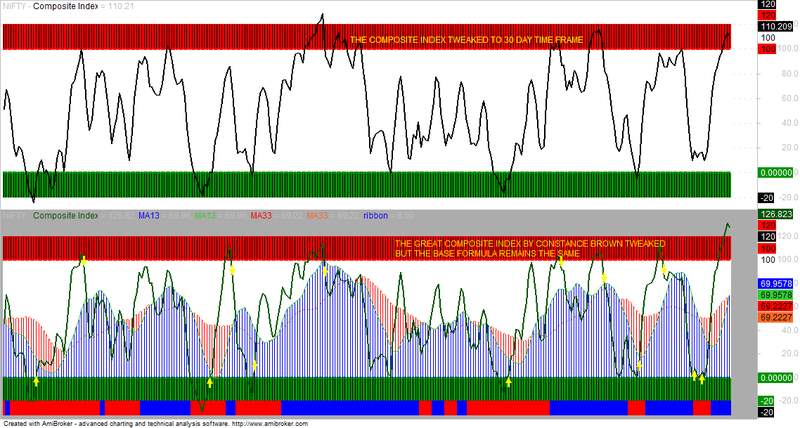
THIS IS THE COMPOSITE INDEX TWEAKED FOR 30 DAY TIME FRAME AND ON REQUEST BY A MEMBER OF THE FORUM.THIS INDICATOR IS NOT TO BE USED FOR EQUITY MARKET BUT ONLY FOR THE BULLION MARKET.THE GREAT FORMULA OF CONSTANCE BROWN IS RETWEAKED FOR THE BULLION MARKET.MOST OF THE INVESTORS LOOK FOR LONGER TIME FRAME IN THE BULLION MARKET AND THE PERIOD IS 50 DAYS.LUNAR CYCLE CALCULATION IS TO BA MADE TO ARRIVE AT THE DECISION MAKING.PLEASE CHECK THIS INDICATOR AND TAKE POSITIONS ONLY ON CONFIRMATION.IF SOME PARAMETERS ARE TO BE RETWAKED CAN DO ON YOUR STUDY.
HOPE YOU ENJOY AND WISHING YOU LUCK
PRASAD MUNI
Screenshots
Indicator / Formula
/*

Reference to:

BreakThroughs in Technical Analysis
Keller, Bloomberg

Composite Index,tweaked to 30 day average instead of 14 day
to be used only for trading in the Bullion market as lunar cycle is considered and 50 day cycle is
suggested.

*/

A=RSI() - Ref(RSI(30),-19)+ MA(RSI(3),3);
Plot(A,"Composite Index",colorBlack,styleThick);
Plot(100,"",colorRed,styleDots,styleArea);
Plot(0,"",colorGreen,styleDots,styleArea);
Overbought=100;
Oversold=0;
Plot(100,"",colorWhite,styleArea);
Plot(120,"",colorBlack,styleHistogram);
Plot(120,"",colorRed,styleArea);
Plot(-20,"",colorBlack,styleHistogram);
Plot(-20,"",colorGreen,styleArea);
Overbought=100;
Oversold=-0;
1 comments
Leave Comment
Please login here to leave a comment.
sir can you also post dmi (directional market index )for amibroker also.