Combination of MFI and Momentum for Amibroker (AFL)
nalin Soni over 13 years ago Amibroker (AFL)
Up Trend =
When Money Flow Index and Stochastic Momentum both are going UP together.
Down Trend =
When Money Flow Index and Stochastic Momentum both are going DOWN together.
Consolidation =
When Money Flow Index and Stochastic Momentum both are going in Opposite Direction
i.e. Money Flow Index is going UP and at the same time Stochastic Momentum is DOWN
OR
Money Flow Index is going DOWN and at the same time Stochastic Momentum is UP.
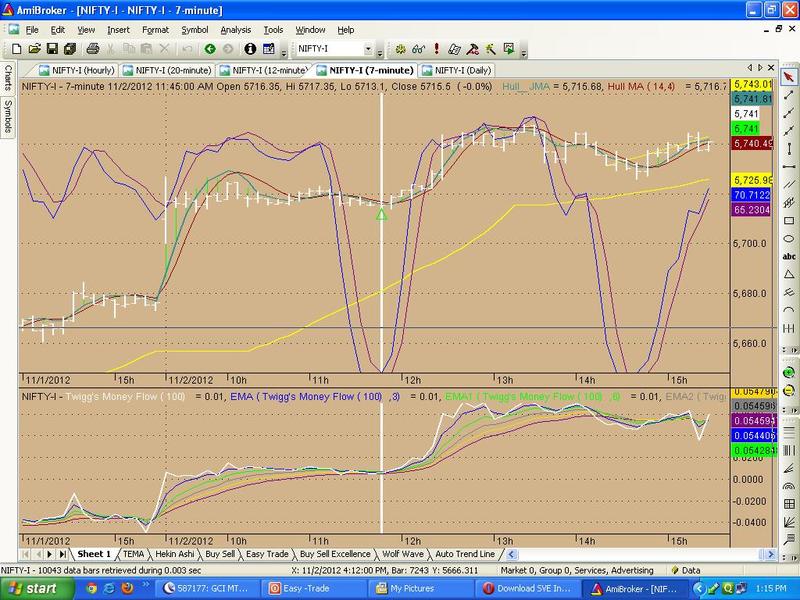
Moreover on the price chart Hull JMA and Hull MA guide us for Price Direction, and Marva Mid-R Line Signal also guide us and give better clue, and during during consolidation Choppiness Index Line OR Price Break Through Line gives us Perfect guidance about Which Side Market Will Start to Go.
Screenshots
Indicator / Formula
_SECTION_BEGIN("Price");
SetChartOptions(0,chartShowArrows|chartShowDates);
_N(Title = StrFormat("{{NAME}} - {{INTERVAL}} {{DATE}} Open %g, Hi %g, Lo %g, Close %g (%.1f%%) {{VALUES}}", O, H, L, C, SelectedValue( ROC( C, 1 ) ) ));
Plot( C, "Close", ParamColor("Color", colorBlack ), styleNoTitle | ParamStyle("Style") | GetPriceStyle() );
_SECTION_END();

_SECTION_BEGIN("Hull JMA");
color   = ParamColor( "Color", colorRed);
style   = ParamStyle( "Style", styleThick);
label   = ParamStr( "label text", "Hull_JMA" );

Price = ParamField("Price");
Period = Param("Period", 10,1,100,1);

function HMA1(Price, Period)
{
return WMA(2*WMA(Price, Period/2)-WMA(Price, Period), sqrt(Period));
}

function JMA1( array, per )
{
TN1=MA(array,per);
s1=0;
for( i = 0; i < per; i=i+1 )
{
s1=s1+((per-(2*i)-1)/2)*Ref(array,-i);
}
return TN1+(((per/2)+1)*S1)/((per+1)*per);
}

a=Param("Hull_JMA",25,1,100,1);
k=Param("Period",10,1,100,1);

L = HMA1(C,k);
M=JMA1(C,k);
N=((L*a)+(M*(100-a)))/100;

Plot( N, label, color, style);
_SECTION_END();

_SECTION_BEGIN("Hull MA");
Period = Param("Period:", 20, 1, 200);
SqrtPeriod = Param("Square Root of Period:", 4, 1, 20);

HullMA = WMA(2 * WMA(C, Period / 2) - WMA(C, Period), SqrtPeriod);
Plot(HullMa, _DEFAULT_NAME(), ParamColor("Hull Moving Average Color", colorBlue));
_SECTION_END();

_SECTION_BEGIN("Stochastic %D");
periods = Param( "Periods", 15, 1, 200, 1 );
Ksmooth = Param( "%K avg", 3, 1, 200, 1 );
Dsmooth = Param( "%D avg", 3, 1, 200, 1 );
Plot( StochD( periods , Ksmooth, DSmooth ), _DEFAULT_NAME(), ParamColor( "Color", colorCycle ), ParamStyle("Style") );
_SECTION_END();

_SECTION_BEGIN("Stochastic %K");
periods = Param( "Periods", 15, 1, 200, 1 );
Ksmooth = Param( "%K avg", 3, 1, 200, 1 );
Plot( StochK( periods , Ksmooth), _DEFAULT_NAME(), ParamColor( "Color", colorCycle ), ParamStyle("Style") );
_SECTION_END();

_SECTION_BEGIN("Average Side Way Mkt");
price = ParamField("field");
n = Param("periods",35);
SA=MA(Price,n);
v1=(StDev(Price,n))^2;

Ca=Null;
Ca[n]=sa[n];

for(i=n+1; i<BarCount;i++){
v2[i]=(CA[i-1]-SA[i])^2;
k[i]=IIf(V2[i]<V1[i],0,1-V1[i]/V2[i]);
CA[i]=CA[i-1]+K[i]*(SA[i-1]-CA[i-1]);
}
Plot(Ca,"OMA("+WriteVal(n,1.0)+")",colorYellow,styleThick);
Col = IIf(BarsSince(Ref(Ca,-1)>Ca)>BarsSince(Ref(Ca,-1)<Ca),colorBrightGreen,colorRed);
Plot(C,"",Col,styleBar);
_SECTION_END();

_SECTION_END();

_SECTION_BEGIN("Show Values at H&L");

n=Param("Values back",20,1,200,1);
p=Param("zig %",5,1,100,1);
dist = 0.8*ATR(15);

for( i = 1; i < n; i++ )
{
	PlotText(""+LastValue(Peak(H,p,i),True),BarCount-3-LastValue(PeakBars(H,p,i)),LastValue(dist,True)+LastValue(Peak(H,p,i),False),colorBlack,ColorRGB(225,225,225));
	PlotText(""+LastValue(Trough(L,p,i),True),BarCount-3-LastValue(TroughBars(L,p,i)),LastValue(Trough(L,p,i),False)-LastValue(dist,True),colorBlack,ColorRGB(225,225,225));
}

_SECTION_END();

_SECTION_BEGIN("Marva Mid R-Line Signal");
x = Cum(1);
lastx = LastValue( x );
Daysback = 10;
aa = LastValue( LinRegIntercept( Close, Daysback) );
bb = LastValue( LinRegSlope( Close, Daysback ) );

y = Aa + bb * ( x - (Lastx - DaysBack) );
//Plot( Close, "Close", colorRose, styleCandle );
Plot( IIf( x >= (lastx - Daysback), y, -1e10 ), "LinReg", colorYellow );
per1=Param ("per1", 0.325,0.1,50,0.10);

perc=per1;
x1=BarIndex();xx=SelectedValue(x);
t1=SelectedValue(ValueWhen(PeakBars(C,perc)==0,x)) ;
H1=SelectedValue(ValueWhen(PeakBars(C,perc)==0,C)) ;
t11=SelectedValue(ValueWhen(TroughBars(C,perc)==0, x));
H11=SelectedValue(ValueWhen(TroughBars(C,perc)==0, C));
g=t1>t11;
shape=IIf(g,shapeHollowDownTriangle*(x==t1),shapeHollowUpTriangle*(x ==t11));
Color=IIf(g,colorRed,colorBrightGreen);
PlotShapes(shape,color);

_SECTION_END();


//*****************************************
 _SECTION_BEGIN("Twigg's Money Flow");
 periods = Param( "Periods", 100, 5, 200, 1 );
 TRH=Max(Ref(C,-1),H);
 TRL=Min(Ref(C,-1),L);
 TR=TRH-TRL;
 ADV=V*((C-TRL)-(TRH-C))/ IIf(TR==0,9999999,TR);
 WV=V+(Ref(V,-1)*0);
 SmV= Wilders(WV,periods);
 SmA= Wilders(ADV,periods);
 TMF= IIf(SmV==0,0,SmA/SmV);
 Plot( TMF, _DEFAULT_NAME(), ParamColor("color", colorCycle ),
 ParamStyle("Style") );
 _SECTION_END();
 //*****************************************

_SECTION_BEGIN("EMA");
P = ParamField("Price field",-1);
Periods = Param("Periods", 15, 2, 200, 1, 10 );
Plot( EMA( P, Periods ), _DEFAULT_NAME(), ParamColor( "Color", colorCycle ), ParamStyle("Style") );
_SECTION_END();

_SECTION_BEGIN("EMA1");
P = ParamField("Price field",-1);
Periods = Param("Periods", 15, 2, 200, 1, 10 );
Plot( EMA( P, Periods ), _DEFAULT_NAME(), ParamColor( "Color", colorCycle ), ParamStyle("Style") );
_SECTION_END();

_SECTION_BEGIN("EMA2");
P = ParamField("Price field",-1);
Periods = Param("Periods", 15, 2, 200, 1, 10 );
Plot( EMA( P, Periods ), _DEFAULT_NAME(), ParamColor( "Color", colorCycle ), ParamStyle("Style") );
_SECTION_END();

_SECTION_BEGIN("EMA3");
P = ParamField("Price field",-1);
Periods = Param("Periods", 15, 2, 200, 1, 10 );
Plot( EMA( P, Periods ), _DEFAULT_NAME(), ParamColor( "Color", colorCycle ), ParamStyle("Style") );
_SECTION_END();

_SECTION_BEGIN("EMA4");
P = ParamField("Price field",-1);
Periods = Param("Periods", 15, 2, 200, 1, 10 );
Plot( EMA( P, Periods ), _DEFAULT_NAME(), ParamColor( "Color", colorCycle ), ParamStyle("Style") );
_SECTION_END();
9 comments
Leave Comment
Please login here to leave a comment.
Hello Nalin ,
You have posted 2-3 afls in last few days
(many afls merged in one Chart)
We need to delete lower code to c the chart. One request to u – Better kindly post single formula.. i would be helpful.
hope u understand.
Thanx you
Hello, Mr.anandnst
I got your concept, next time onwards, I will not do the same mistake, but the lower part in this AFL is not given in our Library, it is basically my own creation, so i had given the same, kindly check it.
very truly Yours,
Nalin Soni
Hello nalin soni,
Thanx you for understanding n Quick response.
Please post in single code or else it is not useful n ur efforts not useful for others. i can make them 2 formula but wt abt others???
Hope u understand.
Regards
Anandnst@gmail.com
*repaint not good sir ji no one worked afl lotsoff afl but no one worked any one ??
@nalin soni & admin: The above chart picture shows Stochastics & Price together in the same chart properly formed. I’m having the same difficulty as anandnst is telling. When I paste this AFL on my Amibroker(ver 5.60) I get a distorted chart. I have deleted the lower part which is Twiggs Money Flow & EMA’s, but still the problem remains. Is there some special setting required in Amibroker for this? How you have managed to get this kind of chart?
@northstar The delet stockastic %d & %k and delet Twig money flow and rty but chart display different to above picture.
nice afl, can u add scan/explore, sir?
regards
Price Text Labels on Screen use future data.
Do a walk forward and you see text indicating highs and Lows suddenly appear in the past when it is too late to act on the signals.
Like wise for the Buy / Sell Signal Triangles.
They twinkle on and off as you walk forward on new data.
I would not use for live trade signals. But that’s just me.
The multi MA ribbon is a good interpretation of Guppy Multi MA’s.
Repaint. Be carefull