Pivot Trading by Karhikmarar for Amibroker (AFL)
THE LORD KSA over 16 years ago Amibroker (AFL)
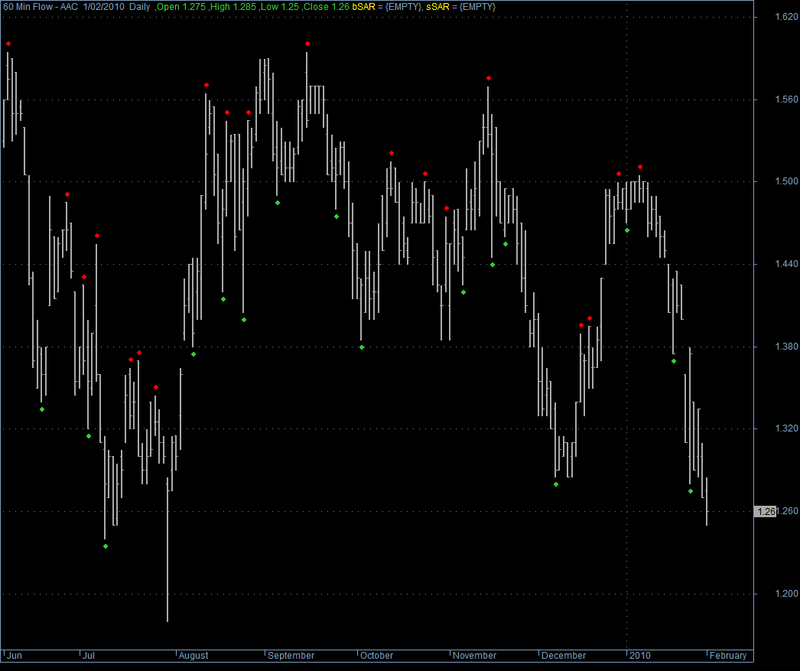
Plots pivots on price chart.
Screenshots
Indicator / Formula
Copy & Paste Friendly
_SECTION_BEGIN("Pivot Trading");
//AFL by Karhikmarar for Pivot trading.
//Best used for guidance only.
SetChartOptions(0,chartShowArrows|chartShowDates);
Title = ("60 Min Flow - " + Name()+"  " + Date() +"  "+Interval(2) +"  "+ EncodeColor(colorLime)+",Open "+Open +" ,High "+H+" ,Low "+L+" ,Close "+C+" "+"{{VALUES}}");

Room=Param("Room",14,4,30,1);
aRoom=Param("Add Room",7,4,30,1);
sr=ParamToggle("Plot SAR lines","No|Yes" ,0);

var1I= H > Ref(H,1) AND H > Ref(H, -1) AND H>Ref(H,-2)AND NOT GapUp() ;
var2I= L < Ref(L,2) AND L < Ref(L, 1) AND L < Ref(L, -1) AND L < Ref(L, -2)AND NOT GapDown();

PlotShapes(shapeSmallCircle*Var1I , colorRed, 0, H, 10 );
PlotShapes(shapeSmallCircle*Var2I, colorLime, 0, L, -10 );
//-----------------------------
HP=ValueWhen((Ref(H,-2) > Ref(H, -4)) AND(Ref(H,-2) > Ref(H, -3)) AND(Ref(H,-2) > Ref(H, -1)) AND(Ref(H,-2) > H),Ref(H,-2),1);


LP= ValueWhen(Ref(L,-2) <= Ref(L, -1) AND Ref(L,-2) <= Ref(L, 0) AND Ref(L,-2) <= Ref(L, -3) AND Ref(L,-2) <= Ref(L, -4),Ref(L,-2),1);


Hpr=Hp+room;
Lpr=Lp-room;

Buy = Cross(C,Hpr);
Sell=Cross(Lpr,C);

Buy = ExRem(Buy,Sell);
Sell = ExRem(Sell,Buy);
inBuy=IIf(BarsSince(Buy)<BarsSince(Sell), True, False);
inShort=IIf(BarsSince(Buy)>BarsSince(Sell), True, False);
Mycolor=IIf(inbuy,colorGreen,IIf(inshort,colorRed,colorBlue));

addup=Ref(inbuy,-1) AND Cross(C,Hpr+aroom) AND NOT GapUp();
adddn=Ref(inshort,-1) AND Cross(lpr-aroom,C) AND NOT GapDown();
shape = Buy * shapeUpArrow + Sell * shapeDownArrow ;
Hpcolor=IIf(inshort ,colorRed,colorBlack);
lpcolor=IIf(inbuy ,colorRed,colorBlack);
PlotOHLC( Open,  High,  Low,  Close, "", Mycolor, styleBar|styleThick  );

Plot(IIf(inshort AND sr,hpr,Null),"bSAR",colorYellow,32 );

Plot(IIf(inbuy AND sr,lpr,Null),"sSAR", colorYellow,32 );
shape = Buy * shapeUpArrow + Sell * shapeDownArrow ;

PlotShapes( shape, IIf( Buy, colorLime, colorRed ),0, IIf( Buy, Low, High ) );
PlotShapes(shapeUpArrow*addup,colorTurquoise,0, L, -20);
PlotShapes(shapeDownArrow*adddn,colorOrange,0, H, -20);


GraphXSpace = 5;
dist = 1.5*ATR(10);

for( i = 0; i < BarCount; i++ )
{
if( Buy[i] ) PlotText( "Cover & Buy\n@" + (Hpr[ i ]+room), i, L[ i ]-dist[i], colorGreen );
if( Sell[i] ) PlotText( "Sell & short\n@" + (Lpr[ i ]-room), i, H[ i ]+dist[i], colorRed);
if( addup[i] ) PlotText( "ADD\n@" + C[ i ], i, H[ i ]+dist[i], colorYellow);
if( adddn[i] ) PlotText( "ADD\n@" + C[ i ], i, H[ i ]+dist[i], colorYellow);
}
0 comments
Leave Comment
Please login here to leave a comment.