Ehlers Adaptive Stochatic Indicator for Amibroker (AFL)
kaiji over 16 years ago Amibroker (AFL)
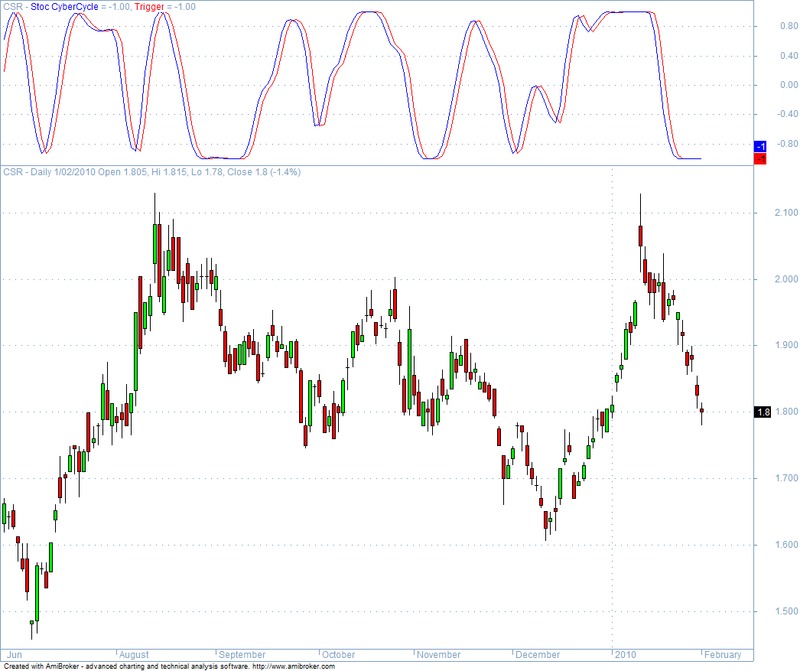
Ehlers Adaptive Stochatic Indicator Cyber Cycle. Modified from original cyber cycle indicator code according to Ehlers book.
By Sony Chauha
Screenshots
Indicator / Formula
Copy & Paste Friendly
//SetBarsRequired( 200, 0 );

// Ehlers CyberCycle
// Cybernetic Analysis for Stocks and Futures
// Chapter 4, p. 33. Code on p. 38.
// Original code is at:
//http://www.traders.com/Documentation/FEEDbk_docs/Archive/052004/TradersTips/TradersTips.html#amibroker

function Fisher(array)
// Figure 1.7 on p. 7
{
  F = array;
  F = .25 * log((1+ array)/(1 - array)) + .5 * Ref(F, -1);
  return F;
};

function CyberCycle( array, alpha )
{
  smooth = ( array + 2 * Ref( array, -1 ) + 2 * Ref( array, -2 ) + Ref( array, -3 ) ) / 6;
  // init value
  Cycle = ( array[ 2 ] - 2 * array[ 1 ] + array[ 0 ] )/4;
  for( i = 6; i < BarCount; i++ )
  {
     Cycle[ i ] = ( ( 1 - 0.5 * alpha) ^ 2 ) *
                  ( smooth[ i ] - 2 * smooth[ i - 1 ] + smooth[ i - 2] ) +
                  2 * ( 1 - alpha ) * Cycle[ i - 1 ] -
                  ( ( 1 - alpha) ^ 2 ) * Cycle[ i - 2 ];
  }

  	MaxCycle = HHV(Cycle, 14);
  	MinCycle = LLV(Cycle, 14);
  	for (i = 0; i < BarCount; i++) {
		if (MaxCycle[i] != MinCycle[i]) {
			Value1[i] = (Cycle[i]-MinCycle[i])/(MaxCycle[i] - MinCycle[i]);
			Value2[i] = (4*Value1[i] + 3*Value1[i-1] + 2*Value1[i-2] + Value1[i-3])/10;
			Value2[i] = 2*(Value2[i] -.5);
		};
	}
  	return Value2;
}

// get log price
logprice = ln(Close);
OA1 = (logprice - Ref(logprice, -1))/sqrt(1);

// get change in bar and multiply it by the change in square root of time between yesterday AND today
n = 0;
totalprice[0]= 0;
for (i = BarCount-1; i>=1; i--){
	n = n + 1;
  	deltaPrice[i] = OA1[i]*(sqrt(n) - sqrt(n-1));
	totalprice[i]  = totalprice[i] + OA1[i]*(sqrt(n));
};

Cycle = CyberCycle( (H+L)/2, .07);
Plot( Cycle, "Stoc CyberCycle", colorBlue );
Plot( Ref(Cycle, -1), "Trigger", colorRed);
0 comments
Leave Comment
Please login here to leave a comment.