TSL&MetaTSL for Amibroker (AFL)
morgen over 13 years ago Amibroker (AFL)
Is a Trailing Stop Loss (TSL) from Metastock formula in AmiBroker formula.
I am very interested in your opinions to do better this TSL.
Thank you
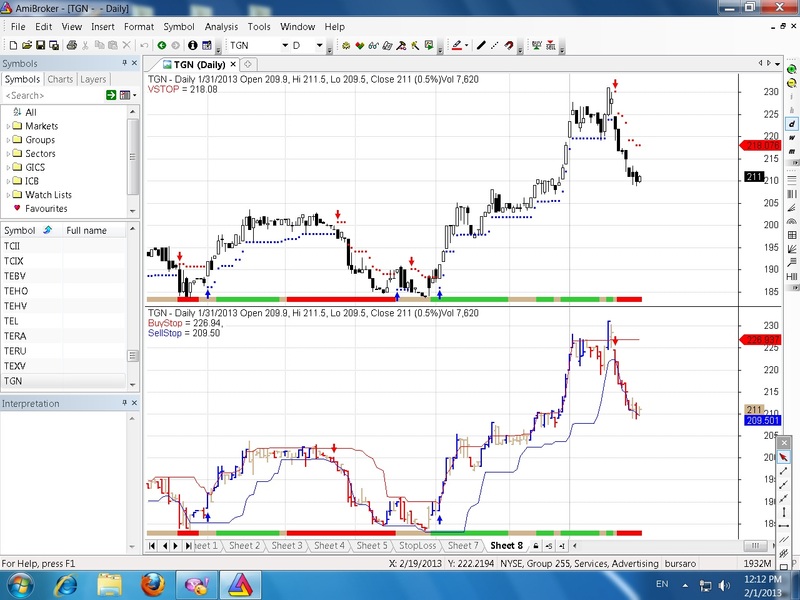
Screenshots
Indicator / Formula
Copy & Paste Friendly
/*
Formula in Metastock

Stop Loss (Buy)= HHV((LLV(L,3)-(ATR(10)/2)),10)

Stop Loss (Sell)= LLV((HHV(H,3)+(ATR(10)/2)),10)

HHV = Highest High Value
LLV = Lowest Low Value
*/

//FORMULA IN AMIBROKER

ATRper= Param("ATRper",12,1,50,1,0) ;
BuyPer= Param("BuyPer",1,1,50,1,0) ;
SellPer= Param("SellPer",1,1,50,1,0) ;

BuyStop= HHV((LLV(L,BuyPer)+(ATR(ATRper)/2)),ATRper) ;
SellStop= LLV((HHV(H,SellPer)-(ATR(ATRper)/2)),ATRper) ;

Plot(BuyStop,"\nBuyStop",colorRed,styleLine) ;
Plot(SellStop,"\nSellStop",colorBlue,styleLine) ;

//xxxxxxxxxxxxxxxxxxxxxxxxxxxxxxxxxxxxxxxxxxxxxxxxxxxxxxxxxxxxxxxxxxxxxxxxxxxxxxxxxxxxxxxxxxxxxxx

//HEIKIN-ASHI ORIGINAL

//SetChartOptions(0,chartShowArrows | chartShowDates);
HaClose = (O + H + L + C)/4;
HaOpen = AMA( Ref( HaClose, -1 ), 0.5 );
HaHigh = Max( H, Max( HaClose, HaOpen ) );
HaLow = Min( L, Min( HaClose, HaOpen ) );
xDiff = (HaHigh - Halow) * 10000;
//barcolor = IIf(HaClose >= HaOpen,colorGreen,colorRed);
//barcolor= IIf(HaClose>=HaOpen AND C>Ref(C,-1) AND C>=O,colorGreen,
//          IIf(HaClose<HaOpen AND C<Ref(C,-1) AND C<O, colorRed, colorBrown)) ;
//SetBarFillColor(IIf(HaClose>=HaOpen,colorBrightGreen,colorOrange));
//SetBarFillColor(IIf(HaClose>=HaOpen AND C>Ref(C,-1) AND C>=O,colorBrightGreen,
//                IIf(HaClose<HaOpen AND C<Ref(C,-1) AND C<O, colorOrange, colorTan)) );
//PlotOHLC( HaOpen, HaHigh, HaLow, HaClose, "\nHeikin-ashi", barcolor, styleCandle );
//PlotOHLC( HaOpen, HaHigh, HaLow, HaClose, "\nHeikin-ashi", colorBlack, styleCandle );

//HaDelta & MA

HaDelta= HaClose-HaOpen ;
MAhadelta= MA(Hadelta,3) ;
Hadeltaup3= Hadelta>MA(Hadelta,3) ;
Hadeltaup33 = Hadelta>MA(MA(Hadelta,3),3) ;
//Plot(Hadelta,"haDelta",colorBlack) ;
//Plot(0,"",colorBrown) ;
//Plot( MA1, "MA1", colorRed );
//Plot( MA2, "MA2", colorBlue );

Haup= HaClose>=HaOpen ;
//xxxxxxxxxxxxxxxxxxxxxxxxxxxxxxxxxxxxxxxxxxxxxxxxxxxxxxxxxxxxxxxxxxxxxxxxxxxxxxxxxxxxxxxxxxxxxxxxxx

//TRENDING RIBBON

// Paste the code below to your price chart somewhere and green ribbon means both
// both MACD and ADX trending up so if the red ribbon shows up the MACD and the ADX
// are both trending down.
_SECTION_BEGIN("trending ribbon");
uptrend= (PDI()>MDI() AND MACD()>Signal()) ;
downtrend=MDI()>PDI() AND Signal()>MACD();
Plot( 2, /* defines the height of the ribbon in percent of pane width */"",
    IIf(uptrend,colorLime,IIf(downtrend,colorRed,colorTan)),styleOwnScale|styleArea|styleNoLabel,-0.5,100 );
_SECTION_END();
//xxxxxxxxxxxxxxxxxxxxxxxxxxxxxxxxxxxxxxxxxxxxxxxxxxxxxxxxxxxxxxxxxxxxxxxxxxxxxxxxxxxxxxxxxxxxxxxxxxxxxxxxxxxxxxxxxxxxxxxxxxx

//MODEL PENTRU 3 CULORI , ADICA 3 CONDITII

//bar3culori= IIf(C> NLBL, colorBlue, IIf(C<NLSL, colorRed, colorTan));//MODEL MODEL MODEL 3 CULORI
//SetBarFillColor(IIf(HaClose>=HaOpen,colorBrightGreen,colorOrange));

//bar3culori= IIf(C> NLBL, colorBlue, IIf(C<NLSL, colorRed, colorTan));//MODEL MODEL MODEL 3 CULORI
//SetBarFillColor(IIf(HaClose>=HaOpen AND C>Ref(C,-1),colorBrightGreen,IIf(HaClose<HaOpen AND C<Ref(C,-1), colorRed, colorTan)) );
//SetBarFillColor= IIf(C> NLBL, colorBlue, IIf(C<NLSL, colorRed, colorTan));//MODEL MODEL MODEL 3 CULORI
//xxxxxxxxxxxxxxxxxxxxxxxxxxxxxxxxxxxxxxxxxxxxxxxxxxxxxxxxxxxxxxxxxxxxxxxxxxxxxxxxxxxxxxxxxxxxxxxxxxxxxxxxxxxxxxxxxxxx

//PRICE

_SECTION_BEGIN("Price");
//SetChartOptions(0,chartShowArrows|chartShowDates);
_N(Title = StrFormat("{{NAME}} - {{INTERVAL}} {{DATE}} Open %g, Hi %g, Lo %g, Close %g (%.1f%%)Vol " +
            WriteVal( V, 1.0 ) + " {{VALUES}}", O, H, L, C, SelectedValue( ROC( C, 1 )) ));
barcolor= IIf(C>O AND C>Ref(C,-1) AND HaClose>=HaOpen,colorBlue,
          IIf(C<O AND C<Ref(C,-1) AND HaClose<HaOpen,colorRed,colorTan)) ;
//Plot( C, "", ParamColor("Color", colorBlack ), styleNoTitle | ParamStyle("Style") | GetPriceStyle() );
Plot( C, "", barcolor,styleBar+styleThick );
_SECTION_END();
//xxxxxxxxxxxxxxxxxxxxxxxxxxxxxxxxxxxxxxxxxxxxxxxxxxxxxxxxxxxxxxxxxxxxxxxxxxxxxxxxxxxxxxxxxxxxxxxxxxxxxxxxxxxxxxxxxxxxxxxxxxx

Buy= Cross(C,buystop) ;
Sell= Cross(sellstop,C) ;

Buy = ExRem(Buy,Sell);
Sell = ExRem(Sell,Buy);

PlotShapes(IIf(Buy,shapeUpArrow,shapeNone),colorBlue,0,Low,Offset=-15);
PlotShapes(IIf(Sell,shapeDownArrow,shapeNone),colorRed,0,High,Offset=-15);
10 comments
Leave Comment
Please login here to leave a comment.
hi,
please share the 1st indicator shown in image
thanks
First indicator is VSTOP/Empottasch and is in this site library.
You can try Buy&VSTOP&PIV&TGL/page 5 in Indicator Pastie too.
morgen, Thank you
changing minimum of AtrPer to 5 from 12 seems to icrease flexibility of the indicator
ATRper= Param(“ATRper”,5,1,50,1,0) ;
Morgen,Thank you for this AFL
Hi
whatever anybody says,I believe the best trailing stop code is as per JIMBERG truth about volatility.
The problem is it was designed for eod basis trading.
How to get the right multiplication factor for intraday use is not known
ONLINETRADING ACADEMY EXPERTS SAID-USE 1.5times ATR
for daytrading use.
ford
For now, I think the best Trailing stop loss (TSL) is the one that is based on ATR.
The best TSL formula I know for now is VSTOP/Empottasch-is in this site: it can be very adaptable with separate data for ATRper, ATRmutiple,ResPer, SuppPer…
TSL is a very important element in trading.
I am alaways waiting for newer and better TSL!
i can not found " VSTOP/Empottasch " that first
afl plese send download link plese i search on this site but not found !!!!!
In “Indicator Pastie” section, look for:
TSL&VSTOP&TGL