Stock Portfolio Organizer
The ultimate porfolio management solution.
Shares, Margin, CFD's, Futures and Forex
EOD and Realtime
Dividends and Trust Distributions
And Much More ....
WiseTrader Toolbox
#1 Selling Amibroker Plugin featuring:
Advanced Adaptive Indicators
Advanced Pattern Exploration
Neural Networks
And Much More ....
RSIS for Amibroker (AFL)
Rating:
4 / 5 (Votes 2)
Tags:
oscillator, trading system, amibroker, overbought, oversold
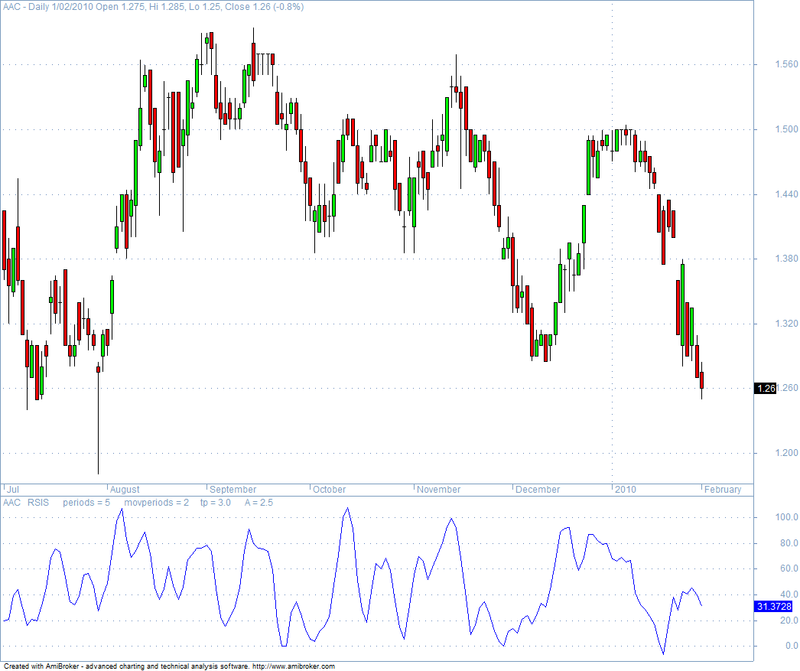
Overbought/Oversold Indicator, same as normaly RSI, but with special moving and low whipsaws. Scale goes from ~ -20 to ~110, this could be changed by your adjustment. Buy methods as every other overbought/oversold Indicator. I’ve added my buy method, which gives sometimes very good signals, but it’s not the holy grail. Test your own way. As with every Indicator you should need other technics, such as chart patterns, etc.. to filter false signals.
By Thomas Zmuck – thomas.zm [at] aon.at
Screenshots
Similar Indicators / Formulas
Rahul Mohindar Oscillator (RMO)
Submitted
by kaiji over 16 years ago
Price Oscillator
Submitted
by ariful_islam over 15 years ago
1 hour stoch
Submitted
by siddhisagar over 15 years ago
Simple Chaikin Buy Sell
Submitted
by jachyuen over 14 years ago
Nj demand and supply
Submitted
by njethva over 13 years ago
Heikin-Ashi Candles Oscillator for Long term
Submitted
by NTA over 13 years ago
Indicator / Formula
Copy & Paste Friendly
/*RSIS  Overbought/Oversold Indicator*/
/*Version 1.0*/
/*Last modified: 26-01-2002 by Thomas Zmuck*/

/*Adjustment-Part*/
pds = 5;  P=RSI(pds);
Movperiods=2;  tp=3;  A=2.5;

/*Formula*/
y=Sum( Cum( 1 ),tp );
y1=( tp * Sum( Cum( 1 ) * P,tp ) -
Sum( Cum( 1 ),tp) * Sum( P,tp) ) /
(tp * Sum( ( Cum( 1 )*Cum(1)),tp ) -
( y*y ) ) * Cum( 1 ) + (MA(P,tp) -
 MA( Cum( 1 ),tp) * (tp * Sum( Cum( 1 ) * P,tp) -
Sum( Cum( 1 ),tp ) * Sum( P,tp) ) /
(tp * Sum( ( Cum( 1 )*Cum(1) ),tp) - ( y*y ) ) );


slope=LinRegSlope(P,tp);
y2=IIf(slope>0 AND y1>HHV(P,3),HHV(P,3),
IIf(slope<0 AND y1<LLV(P,3),LLV(P,3),y1));
y3= EMA(y2,movperiods);

e1= EMA(P,movperiods + 1);
e2= EMA(e1,movperiods + 1);
e3= EMA(e2,movperiods + 1);
e4= EMA(e3,movperiods + 1);
e5= EMA(e4,movperiods + 1);
e6= EMA(e5,movperiods + 1);
c1=-A*A*A;
c2=3*A*A+3*A*A*A;
c3=-6*A*A-3*A-3*A*A*A;
c4=1+3*A+A*A*A+3*A*A;
t3=c1*e6+c2*e5+c3*e4+c4*e3;

RSIS = (y3 + t3) / 2;
/*End Formula*/

/*Graph-Part*/
Plot(RSIS,"RSIS",6,1);
/*End Graph-Part*/


/*Buy Conditions
(not used, only for testing systems*/
Cond1 = Ref(RSIS,-1)<20;
Cond2 = Ref(RSIS,-2)<20;
Cond3 = Ref(RSIS,-1) < Ref(RSIS,-2);
Cond4 = Ref(RSIS,-2) < Ref(RSIS,-3);
Cond5 = RSIS > Ref(RSIS,-1);
Cond6 = CCI(30)<100 AND CCI(30)>-100;

/*Buy and Sell Conditions*/
Buy  = Ref(rsis,-1)<50 AND RSIs > Ref(RSIs,-1);
Sell = Ref(rsis,-1)>70 AND RSIs < Ref(RSIs,-1);

Buy  = ExRem(Buy,Sell);
Sell = ExRem(Sell,Buy);
/*End Buy and Sell Conditions*/

/*Title-Part*/
Title = Name()
+ "   RSIS      periods = "
+ WriteVal(pds,1)
+ "      movperiods = " + WriteVal(movperiods,1)+ "     tp = " +
WriteVal(tp,1.1) + "      A = " + WriteVal(A,1.1);
/*End Title-Part*/
0 comments
Leave Comment
Please login here to leave a comment.
Back